Hosted demo — paste a URL, upload a HAR, or browse the demo scenarios. HTTPS-only, SSRF-guarded, rate-limited.
"My API call is returning a 401 — can you take a look?" Anyone who has done technical support for an API product has had this conversation a thousand times. The actual answer is almost always one of a small handful of things — an expired token, a copy-paste that picked up a trailing newline, a clock skew, a CORS preflight, a content-length mismatch, a TLS chain that broke when the cert rotated. Finding it takes ten minutes of network-tab archaeology that the support engineer has to do over and over again, on every ticket, all day.
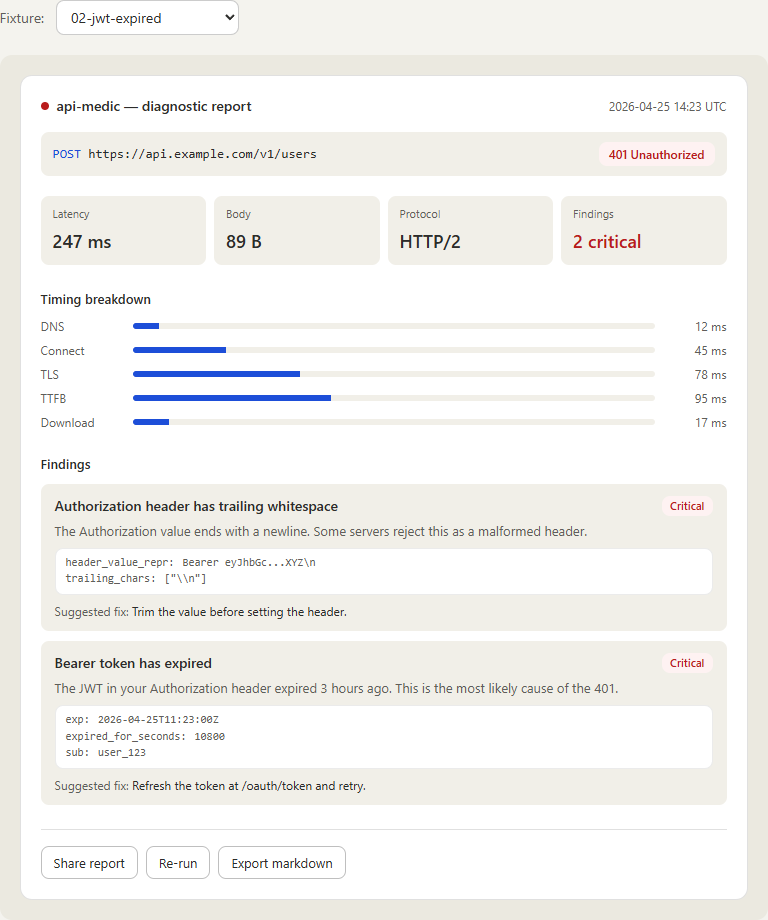
api-medic is the tool I wanted to have on my desk for that work. You hand it a request — as a URL, a curl command, a HAR file from the browser, or a captured request from its DevTools panel — and it runs the same twenty diagnostic checks every time, returns a structured report with evidence and a suggested fix, and renders it as terminal output, JSON, markdown, or a polished HTML report. Same engine, four surfaces, identical results.
01 // The Challenge
Two things were going on at once. First, the diagnosis loop for HTTP failures is repetitive and rote — the same ten or fifteen failure modes account for the vast majority of real tickets, and there's no good reason a human should be the one pattern-matching them every time. Second, the existing tools all live at the wrong layer. Curl gives you bytes. Postman gives you a request builder. Wireshark gives you packets. None of them tell you "the JWT in your Authorization header expired three hours ago and that's why you're seeing 401" in plain English with the evidence quoted underneath.
The brief I set for myself: build something that takes the request the user is already holding — in whatever form they have it — and produces a report a junior support engineer could hand to a customer without rewriting. The report has to be the same regardless of how you get there, the checks have to be stable enough to reference by ID in tickets and runbooks, and the tool has to be deployable as something a customer can actually use without installing anything.
02 // The Stack
Each piece exists to solve a specific problem in the diagnosis loop, not because it was the trendy choice.
- Python 3.10+ core — parser, HTTP runner, twenty diagnostic checks, four renderers. Pure-Python core with a tight, focused dependency set. No web framework in the core; the surfaces compose around it.
- httpx — modern HTTP client with HTTP/2, async, and rich transport-level hooks. Picks up timing data (DNS, connect, TLS, TTFB, download) without a wrapper layer.
- dnspython — DNS resolution checks. Looks up A, AAAA, CNAME records, surfaces NXDOMAIN/SERVFAIL distinctly so the report can say "the host doesn't exist" instead of "connection failed".
- cryptography — TLS certificate parsing for expiration, hostname mismatch, and weak-protocol detection. The X.509 layer is the part that benefits most from a real library instead of regex over
openssl s_clientoutput. - Pydantic — every
Report,Finding, andEvidenceobject is a Pydantic model. The four renderers serialize the same model — terminal, JSON, markdown, HTML — so the surfaces never diverge. - React 18 + TypeScript + Vite + Tailwind — frontend for the web UI and hosted demo. TypeScript types are auto-generated from the Pydantic models, and the generated types are diffed in CI so the frontend cannot silently drift from the core.
- Chrome / Firefox MV3 extension — DevTools panel, captures requests client-side from the network log, ships only the selected request to the analysis backend.
- AWS Lambda — hosts the public demo. Cold-start budget is the constraint that drove a deliberate choice not to bring FastAPI/uvicorn — the request handler is a thin Lambda function over the same Python core, with an SSRF guard in front of the runner.
03 // Architecture Overview
One engine, four surfaces, identical reports. Whichever way the request comes in — typed into a CLI, posted to the hosted Lambda, captured by the browser extension — it ends up as the same internal Request object, runs through the same twenty checks, and produces the same Report. The four renderers are interchangeable; pick the one that fits where the report is being read.
            ┌────────────────┐  ┌──────────────┐  ┌──────────────────┐  ┌────────────────────┐
            │      CLI       │  │ Local Web UI │  │   Hosted Demo    │  │ Browser Extension  │
            │  api-medic …   │  │ :8765 (local)│  │ AWS Lambda       │  │ DevTools panel     │
            └────────┬───────┘  └──────┬───────┘  └────────┬─────────┘  └────────┬───────────┘
                     │                 │                   │                     │
                     └────────┬────────┴────────┬──────────┴──────────┬──────────┘
                              ▼                 ▼                     ▼
                        ┌─────────────────────────────────────────────────────┐
                        │              api-medic core (Python)                │
                        │   parser  →  HTTP runner  →  20 checks  →  Report   │
                        └─────────────────────────────────────────────────────┘
                                              │
                              ┌───────────────┼────────────────┐
                              ▼               ▼                ▼
                          terminal          JSON          markdown / HTML
The Lambda surface gets one extra piece in front of the runner: an SSRF guard that resolves the target host, blocks private and link-local ranges, and forces HTTPS-only with per-IP throttling. The CLI and the local web UI skip that guard — they trust the local user — and the browser extension captures requests client-side, so the analysis never sees anything the user's own browser couldn't already make.
04 // The 20 Diagnostic Checks
Every check has a stable, namespaced ID — auth.jwt.expired, network.tls.expired, http.cors.misconfigured, body.content_length_mismatch. The IDs are the contract: tickets and runbooks can reference a check by ID, filter on it in CI, suppress it for a known case — all without coupling to whatever the human-readable title happens to say this week. The five categories below carve the 20 checks into things a support engineer thinks about distinctly:
One scoping note worth being explicit about: JWT signatures are not verified. The token is decoded for claims (exp, nbf, iss, aud) because those are what produce the kind of "expired three hours ago" finding that's actually useful. Full signature verification needs the issuer's secret or public key, which is out of scope for a tool that doesn't know which tenant it's looking at.
05 // The CLI
The CLI is the surface I use most. Four input modes, four output formats, designed to live inside a script or a CI step as easily as it lives in an interactive terminal session.
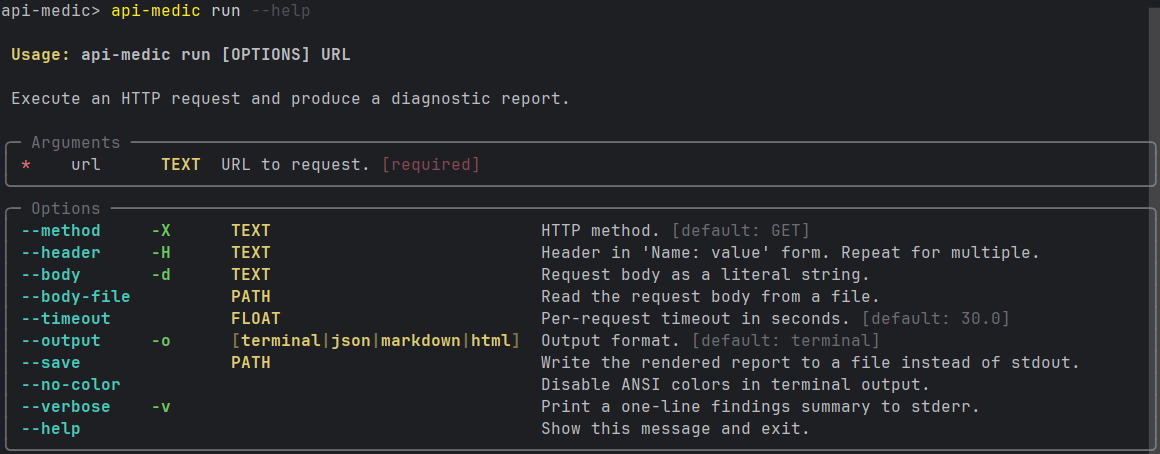
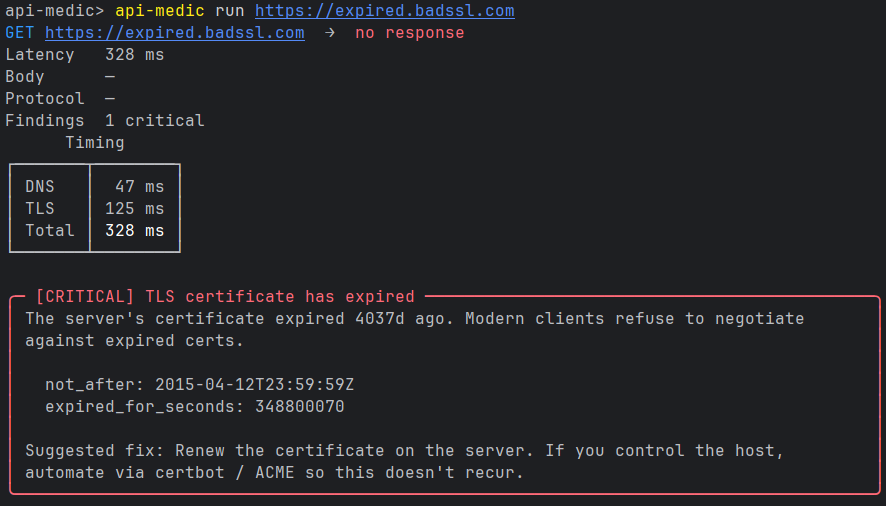
The terminal renderer runs first because it's the one that needs the most work. Color, ANSI box-drawing for the timing panel, severity glyphs, and a deliberately tight layout so a critical finding fits on one screen. The other renderers are mechanical translations of the same Report object — JSON for tooling, markdown for ticket pastes, HTML for the polished web view.
# Simple URL — defaults to GET, terminal output
api-medic https://api.example.com/v1/users

# Full request with headers and body
api-medic run https://api.example.com/v1/users \
    --method POST \
    --header "Authorization: Bearer ..." \
    --body '{"name": "Alex Doe"}'

# Re-run a curl command the user pasted into the ticket
api-medic from-curl 'curl -X GET https://api.example.com/v1/users -H ...'

# Analyze a HAR exported from the browser network tab
api-medic from-har session.har

# Launch the local web UI
api-medic serve
06 // The Web UI
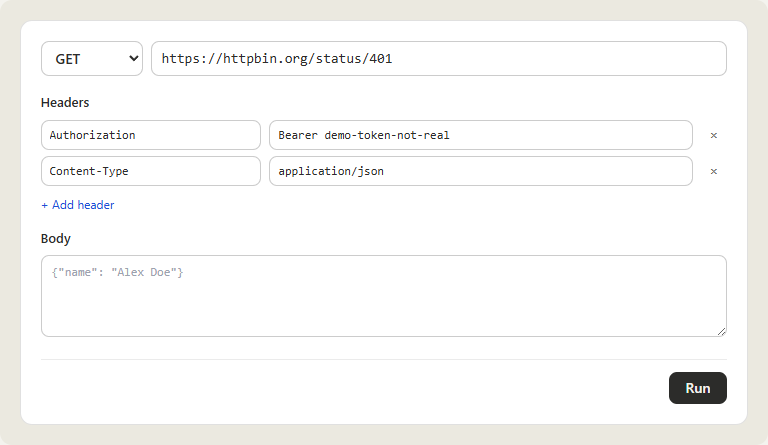
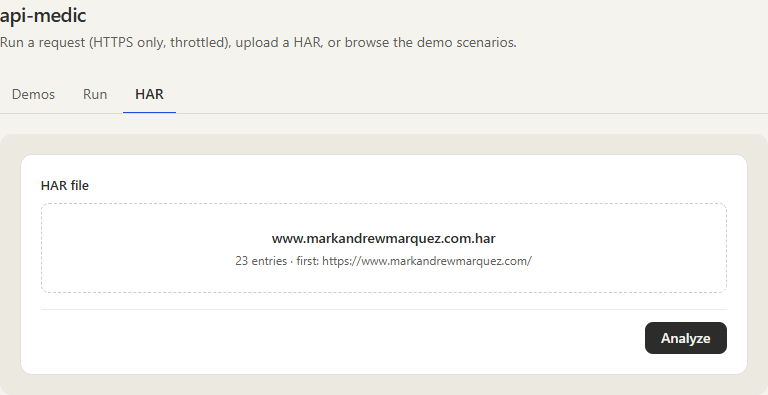
The web UI is the surface a customer or a ticket reporter uses. Everything is form-driven — no commands to remember, no flags to look up — and every input maps onto the same internal Request the CLI builds. The local mode (api-medic serve) and the hosted demo render the same UI; the only difference is that the hosted version refuses non-HTTPS targets and runs every request through the SSRF guard.
The HAR tab is the one that earns its keep on real tickets. A user reports "a request failed in the browser an hour ago" and instead of describing it, they hit File → Save All As HAR in DevTools, drop the file in, and pick the failing entry. api-medic re-runs the request as captured — same headers, same body, same cookies — and produces a report against the live response. The same machinery that re-runs a single entry can iterate over the whole HAR and surface anything that already had a finding embedded in the original capture.
The third tab — Demos — ships eight bundled scenarios covering the failure modes the tool is built to catch (expired TLS, expired JWT, CORS misconfiguration, content-length mismatch, and a few others). It exists so a first-time visitor can see the report shape and the suggested-fix copy without needing a broken endpoint of their own.
07 // The Browser Extension
The browser extension closes the last gap — the case where the user is looking at the failing request right now in their own DevTools and shouldn't need to export a HAR file just to ask a question about it. It's a Chrome/Firefox extension that registers a DevTools panel, listens to the same chrome.devtools.network events that populate the Network tab, and lets you analyze any captured request with one click. Capture happens client-side; only the selected request is sent to the analysis backend.
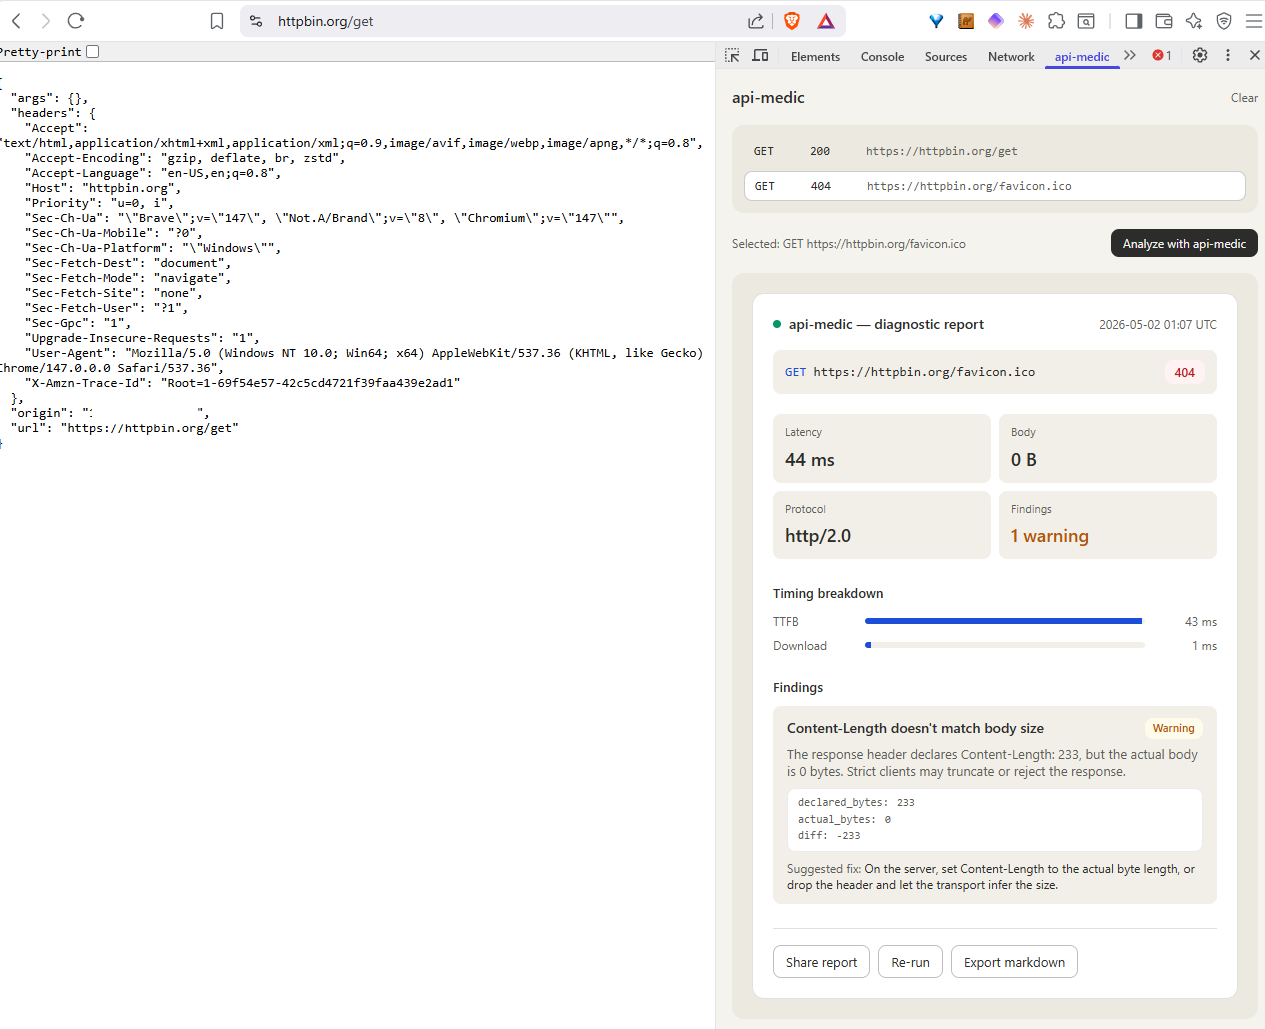
The extension UI is intentionally small — list the captured requests, let the user click "Analyze with api-medic" on one, render the same report inline. Every other surface in the project gets the rich diagnostic experience; the extension's job is to be where the user already is, which means staying out of the way of the rest of DevTools.
08 // Hosting on Lambda Without FastAPI
The hosted demo is the one place where deployment shape mattered. A diagnostic tool is exactly the thing people open once, paste one request into, and close — bursty, low-volume, long idle gaps. That traffic shape is a perfect fit for Lambda's scale-to-zero model, and a perfect mismatch for anything that pays a multi-hundred-millisecond cold-start tax just to spin up an ASGI server.
So FastAPI/uvicorn are excluded from the hosted build on purpose. The Lambda handler is a thin function that maps the API Gateway event onto the same internal Request object the CLI uses, runs the SSRF guard, calls the runner, and returns a rendered report. Everything the core needs is already imported as part of the cold start; nothing extra has to wake up.
The SSRF guard is the load-bearing piece for letting this run as a public surface at all. Targets are resolved before the request fires; any address that resolves into 10.0.0.0/8, 172.16.0.0/12, 192.168.0.0/16, 127.0.0.0/8, link-local, multicast, or the AWS instance metadata service is rejected. HTTPS is enforced on the input. Per-IP throttling sits in front of the handler, and request timeouts are hard-capped server-side regardless of what the client asks for. The combination keeps the demo from becoming a free packet generator.
The other half of running this safely as a public surface is honesty about what the service does with what it sees. The hosted demo is stateless: nothing in the request, response, or generated report is persisted server-side — the report is rendered into the response and discarded with the Lambda invocation. The repository ships a PRIVACY.md that states this in plain language so anyone pasting a real-looking URL into the demo can verify what happens to it.
09 // Results
api-medic (1.1.1 as of 2026-05); hosted demo live at api-medic.markandrewmarquez.com on AWS Lambda + CloudFront/S3; Chrome/Firefox MV3 DevTools extension installable via load-unpacked, store submissions in review.Report; identical input produces byte-identical output. TypeScript types are auto-generated from the Python models so the frontend cannot drift.PRIVACY.md).ruff check, ruff format --check, mypy, and a TypeScript type-generation diff all run on every PR. A merge fails if any gate fails or if the generated frontend types fall out of sync with the Python models.10 // What I Took From It
- Stable IDs are the actual product. The 20 checks aren't valuable because they cover every possible HTTP failure — they don't, and they shouldn't. They're valuable because
auth.jwt.expiredis a thing a runbook can reference, a CI gate can grep for, and a customer ticket can quote. The IDs are the contract; the human-readable titles are decoration. - One core, many surfaces. Putting the parser, runner, and renderers in a pure-Python core meant the CLI, web UI, hosted demo, and browser extension all produce identical reports for identical input. Diverging surfaces would have meant diverging bug reports — "I get a different finding when I run it from the extension" is the kind of question I never want to answer.
- Pick the deployment shape before picking the framework. Lambda's cold-start budget made the choice not to use FastAPI feel obvious in retrospect — but only because the deployment shape got picked first. If I had reached for FastAPI by reflex, the public surface would have been measurably worse on the dimension that actually mattered (first-request latency on a tool people open once and close).
- HAR is an underrated input format. The browser already captures everything you need to reproduce a failed request. Asking the user to "export the HAR and drop it in" is dramatically less ambiguous than asking them to "describe what you did", and it preserves headers and cookies the user doesn't even know to mention.
- Honest scope notes save tickets. Calling out up front that JWT signatures aren't verified is worth more than quietly under-checking and getting asked about it later. The constraint is in the README, in the report's footer, and in the check description. People accept boundaries that are stated; they file bugs against ones that are hidden.
11 // Try It
The hosted demo is live — paste a public HTTPS URL, upload a HAR, or browse the eight bundled demo scenarios on the Demos tab. Source is open at github.com/marky224/api-medic — Python core, CLI, web UI, browser extension, and Lambda deploy all in the same repo.
Local install (api-medic on PyPI, currently 1.1.1):
pip install api-medic
api-medic https://api.example.com/v1/users    # CLI
api-medic serve                                # local web UI on :8765