Live monitoring dashboard for my own infrastructure — built with CloudWatch Synthetics and Terraform.
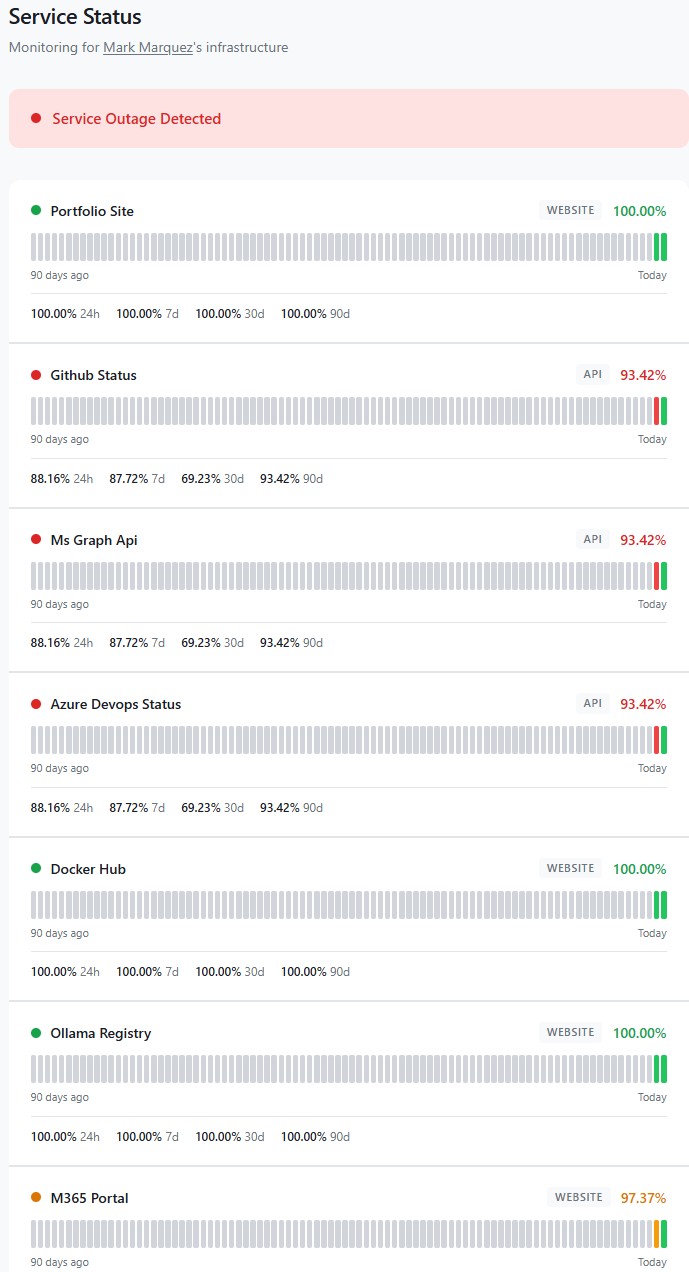
Commercial uptime monitoring is a solved problem — Datadog, Pingdom, UptimeRobot, Better Stack. They all work. They also all cost $20–50/month by the time you add enough endpoints and a public status page, which is absurd for a personal setup where I just want to know if my portfolio site, a few dev-tool registries, and the cloud services I depend on are actually reachable. This project is the AWS-native alternative: one CloudWatch Synthetics canary, seven endpoints, a Terraform stack that deploys end-to-end, and a public status page at status.markandrewmarquez.com — all for about the price of a cup of coffee per year.
01 // The Challenge
The brief I set for myself: monitor the services I actually depend on, alert me when they break, and publish uptime history somewhere public — all without the monthly SaaS bill and without writing a single thing I couldn't rebuild from code. The hard constraint was budget: $1–2/month, total. That constraint drove almost every architectural decision that followed.
Two things had to be true for this to work. First, every resource needed to be defined in Terraform so the whole stack could be destroyed and re-applied without ceremony. Second, the monitoring architecture had to collapse cost aggressively — commercial tools charge per monitor, and AWS Synthetics charges per canary run, so the obvious first instinct of "one canary per endpoint" would blow the budget before the first alarm ever fired.
02 // Architecture & Stack
The entire stack lives in a single AWS region (us-east-1, because CloudFront requires its ACM certificate there anyway) and deploys with terraform apply:
- Canary — CloudWatch Synthetics, runtime
syn-nodejs-puppeteer-13.1(Node.js 22, Puppeteer 24). One canary, sevenexecuteHttpStep()calls per run. - Scheduler —
rate(30 minutes). Tight enough to catch real outages, loose enough to stay inside the free tier's edges. - Alerts — CloudWatch Alarms → SNS topic → email. One alarm per endpoint, bound to its step's
SuccessPercentmetric. - Status page generator — Python Lambda queries CloudWatch via
GetMetricData, writesstatus.jsonto S3 on a schedule. - Status page frontend — static HTML/CSS/JS on S3, fronted by CloudFront with an ACM cert, at
status.markandrewmarquez.com. - IaC — Terraform 1.5+, AWS provider 5.x,
archiveprovider 2.x for zipping the canary script. - DNS — GoDaddy CNAME pointing at the CloudFront distribution (the one manual step in the whole build).
03 // Architecture Overview
                 ┌──────────────────────────────┐
                 │  CloudWatch Synthetics Canary │
                 │     (1 canary · 30 min)      │
                 └──────────────┬───────────────┘
                                │  executeHttpStep × 7
                ┌───────────────┼───────────────┐
                ▼               ▼               ▼
        portfolio-site   github-status   ms-graph-api   …
                │               │               │
                └──────────┬────┴────┬──────────┘
                           ▼         ▼
                  SuccessPercent metric  (per step)
                           │
              ┌────────────┼────────────┐
              ▼                         ▼
      CloudWatch Alarms         Lambda (5 min schedule)
              │                         │
              ▼                         ▼
           SNS topic             status.json on S3
              │                         │
              ▼                         ▼
           Email inbox         CloudFront + ACM
                                        │
                                        ▼
                     status.markandrewmarquez.com
04 // The Single-Canary Trick
This is the piece of the architecture I'm most happy with. Synthetics bills per canary run, not per step. A canary that runs every 30 minutes costs roughly the same whether it checks one endpoint or ten. The catch is that a naive implementation — a single fetch() loop with a pass/fail return — gives you one metric for the whole canary, so you can't tell which endpoint broke.
The fix is executeHttpStep(). Each call emits its own SuccessPercent metric in CloudWatch, dimensioned by CanaryName and StepName. So one canary, seven steps, seven independent metrics, seven independent alarms — for the price of one canary run. The script iterates over the monitors list and calls executeHttpStep once per endpoint:
const monitors = ${jsonencode(monitors)};

exports.handler = async () => {
  for (const monitor of monitors) {
    const url = new URL(monitor.url);

    const requestOptions = {
      hostname: url.hostname,
      path:     url.pathname + url.search,
      port:     url.port || (url.protocol === 'https:' ? 443 : 80),
      protocol: url.protocol,
      method:   'GET',
      headers:  { 'User-Agent': 'Amazon-CloudWatch-Synthetics' },
    };

    const stepConfig = {
      includeRequestHeaders:  false,
      includeResponseHeaders: false,
      includeRequestBody:     false,
      includeResponseBody:    monitor.type === 'api',
      continueOnStepFailure:  true,
    };

    await synthetics.executeHttpStep(
      monitor.name,
      requestOptions,
      validateResponse(monitor),
      stepConfig
    );
  }
};
Two subtleties I only found after breaking things:
continueOnStepFailure: trueis non-negotiable. Without it, the first failing endpoint aborts the whole canary run and every endpoint after it gets no metric — which means the remaining alarms would silently flip to "insufficient data" whenever the first endpoint was actually down. You want the canary to keep going through the list even when something is broken.includeResponseBodyhas to betruefor API checks. Otherwiseresponse.bodyis empty inside the validation callback and you can't do JSON validation on things like the GitHub Status or Azure DevOps health endpoints. For website-type checks it staysfalseto avoid hauling HTML back through CloudWatch.
05 // Endpoint Selection
Seven endpoints, chosen to reflect the services I actually touch in a normal week — not a synthetic "demo" list:
- portfolio-site —
markandrewmarquez.com. Website check — simple HTTP 200. - github-status —
www.githubstatus.com/api/v2/status.json. API check — validatesstatus.indicatorexists in the JSON. - ms-graph-api —
graph.microsoft.com/v1.0/$metadata. API check — validates the XML contains themicrosoft.graphnamespace. The$metadataendpoint is unauthenticated and returns the service schema, so it's a clean liveness signal for the Graph API without needing a tenant token. - azure-devops-status —
status.dev.azure.com/_apis/status/health. API check — validates the JSON has astatusfield. Azure's main status page (azure.status.microsoft) is client-side rendered with no public JSON, so Azure DevOps is the closest public health API I could wire up. - docker-hub —
hub.docker.com. Website check. If this goes down, half my CI does too. - ollama-registry —
registry.ollama.ai. Website check. Feeds the local Ollama install on my AI assistant PC. - m365-portal —
www.office.com. Website check. The tenant-level M365 Service Health API requiresServiceHealth.Read.All, so the front-door HTTP check is the right proxy for "is M365 reachable from the public internet".
The endpoint list is a Terraform variable. Adding or removing a monitored service is a one-line change and a terraform apply — the script template re-renders, the zip re-packages, and for_each creates or destroys the matching CloudWatch alarm automatically.
06 // Infrastructure as Code
The Terraform project is seven files, split by responsibility so each one does exactly one thing:
cloudwatch-monitor/
├── main.tf                  # Provider config (aws + archive)
├── variables.tf             # Endpoint list, interval, email
├── canary.tf                # S3 artifacts bucket, IAM role, canary
├── alarms.tf                # SNS topic + per-endpoint alarms
├── status-page.tf           # S3, CloudFront, Lambda, ACM cert
├── outputs.tf               # Console URLs, status page URL
└── canary-script/
    └── index.js.tftpl       # Node.js canary template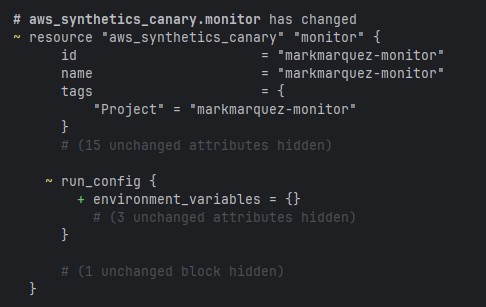
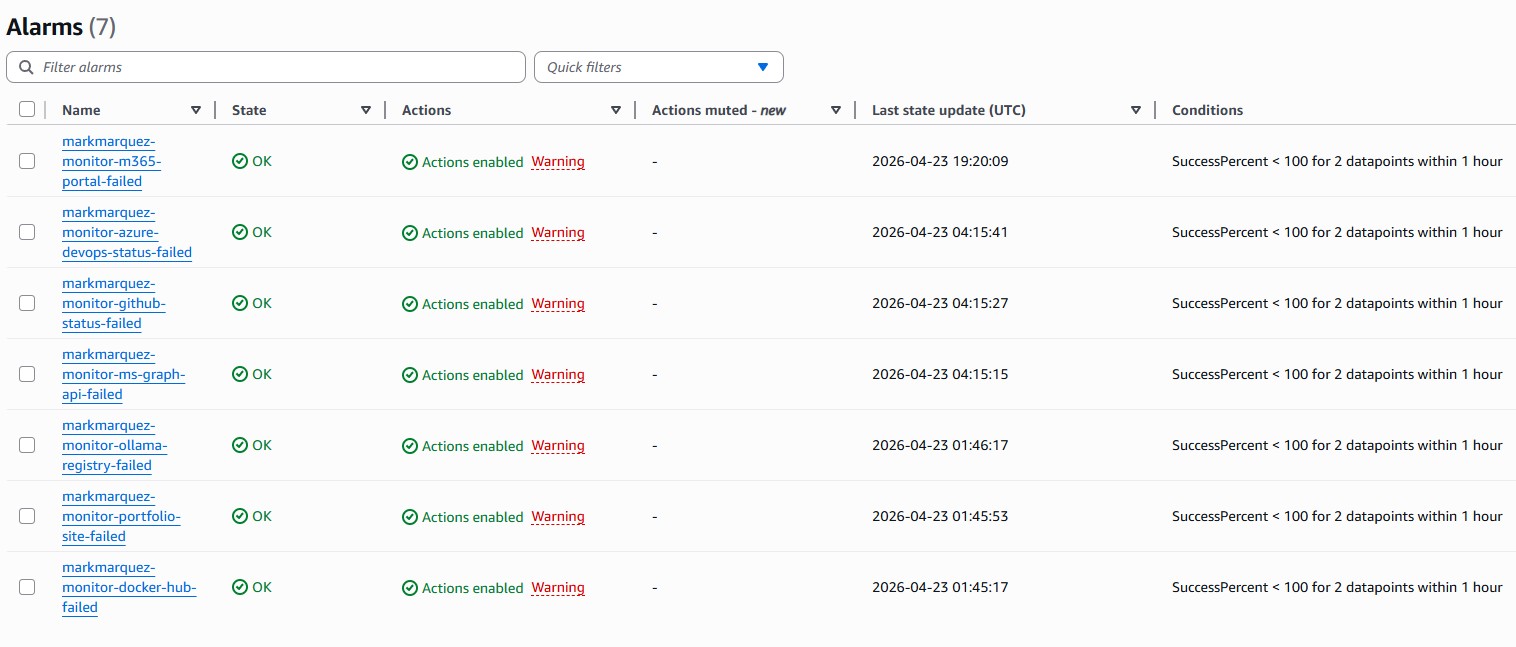
The alarms file is the piece that benefits most from for_each — one block generates every per-endpoint alarm from the shared monitors variable:
resource "aws_cloudwatch_metric_alarm" "endpoint_alarms" {
  for_each = { for m in var.monitors : m.name => m }

  alarm_name          = "$${var.project_name}-$${each.key}-failed"
  comparison_operator = "LessThanThreshold"
  threshold           = 100
  evaluation_periods  = 2
  datapoints_to_alarm = 2

  metric_name = "SuccessPercent"
  namespace   = "CloudWatchSynthetics"
  statistic   = "Average"
  period      = var.canary_interval_minutes * 60

  dimensions = {
    CanaryName = aws_synthetics_canary.monitor.name
    StepName   = each.key
  }

  treat_missing_data = "breaching"
  alarm_actions      = [aws_sns_topic.alarm_notifications.arn]
  ok_actions         = [aws_sns_topic.alarm_notifications.arn]
}
Two consecutive 100%-success-threshold breaches are required before the alarm fires — one transient network blip at 30-minute intervals isn't enough to wake me up, but an hour of sustained failure will. Missing data is treated as breaching, so if the canary itself stops running entirely, that counts as failure too. ok_actions is wired to the same SNS topic so I get a "back to normal" email when things recover.
07 // The Status Page Pipeline
The public status page is deliberately boring infrastructure: no server, no database, no framework. Just a JSON file on S3 and a static HTML page that fetches it.
CloudWatch metrics (SuccessPercent per step)
       │
       ▼
Lambda (Python · every 5 min)
  GetMetricData → build status.json
       │
       ▼
S3 bucket (status.markandrewmarquez.com)
       │
       ▼
CloudFront + ACM cert (us-east-1)
       │
       ▼
Browser ← fetch('/status.json') every 30s
The Lambda function is about 60 lines of Python. It reads the endpoint list from an environment variable, calls GetMetricData for each step's SuccessPercent over the last 24 hours, and writes a small JSON document with each endpoint's current status and recent uptime percentage. The static frontend polls that file every 30 seconds and re-renders — green dots for healthy, red for failing, a last-updated timestamp so it's obvious when the data is stale.
The DNS handoff is the only piece Terraform doesn't manage: GoDaddy hosts the zone for markandrewmarquez.com, so adding the CNAME for the status subdomain is a manual two-minute step in the GoDaddy console after terraform apply finishes. Terraform outputs the CloudFront distribution domain as a convenience so there's nothing to copy-paste from the console.
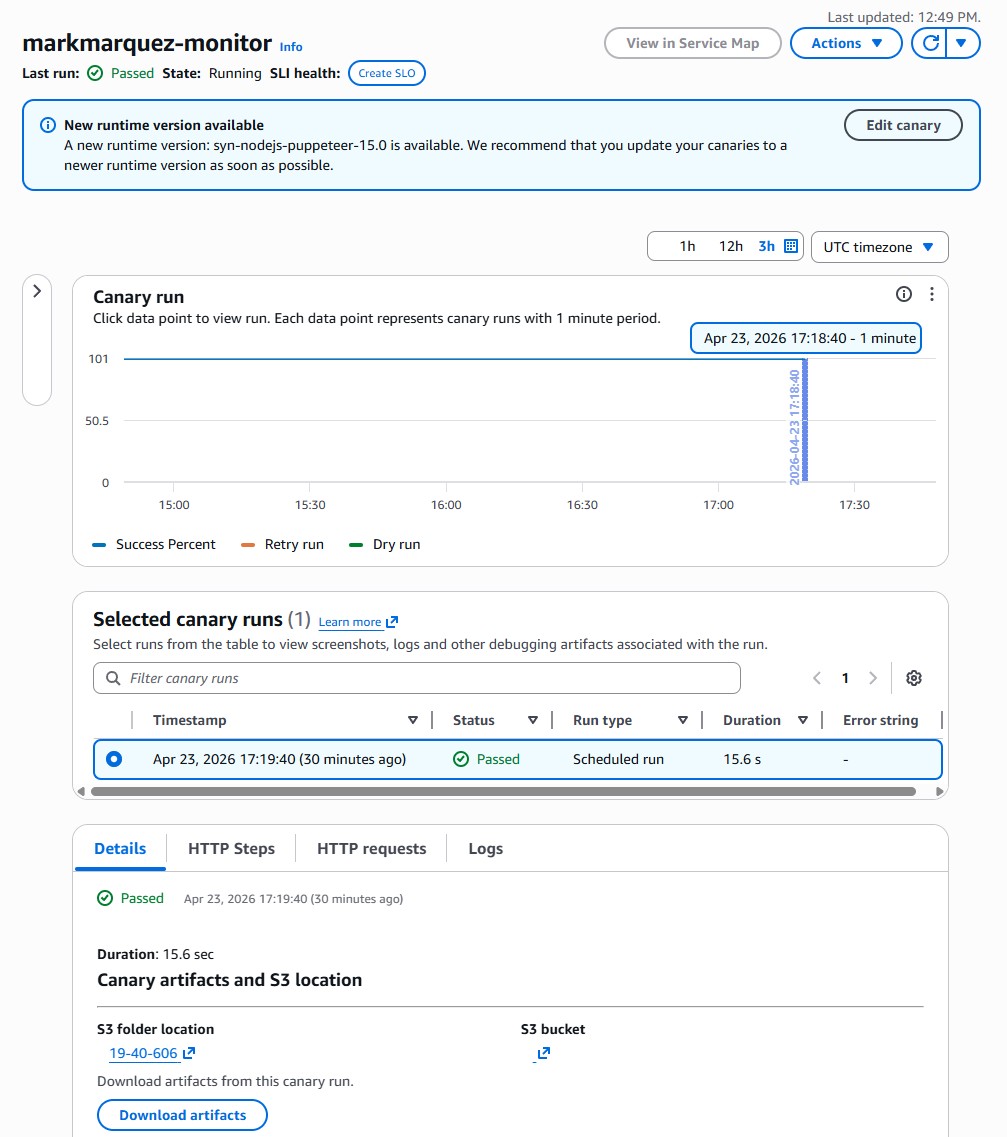
08 // Results
terraform apply stands up the entire stack from zero, including CloudFront and ACM.09 // What I Took From It
- Cost-aware architecture pays off. The single-canary-with-steps pattern is the whole reason the bill sits at $1.73 instead of $12. Reading the Synthetics pricing page carefully before writing a line of code was worth more than any IaC discipline afterwards.
- Terraform rewards boringness. Splitting the stack across files by responsibility — canary, alarms, status page — and driving per-endpoint resources with
for_eachmeant that adding the seventh endpoint was genuinely a one-line change. No surgery, no copy-paste. - Public status pages don't need a framework. Lambda → JSON on S3 → static HTML is a pipeline that will keep working for years without maintenance. Compare that to anything with a runtime, a database, or a dependency tree.
- The right monitored endpoints matter more than the monitor. Picking the services I actually depend on — GitHub, Docker Hub, Ollama registry, M365 — makes the status page useful to me. Picking whatever is easiest to check would have made it decoration.
- The small gotchas are where the time goes.
continueOnStepFailure,includeResponseBody, S3 lifecycle rules needing an explicitfilter {}block, ACM having to live inus-east-1— none of these are hard, but every one of them is an hour of debugging the first time you hit it.
The biggest lesson is the same one that keeps showing up across every build: constraints make architecture better. A $2/month budget eliminated every lazy option and forced the single-canary pattern, which turned out to be the cleanest design anyway.
10 // Try It
Open-source at github.com/marky224/cloudwatch-monitor. Live status page at status.markandrewmarquez.com. Full setup: an AWS account with CLI credentials configured, Terraform 1.5+, an email address to receive alerts, and a domain if you want the public status page. Clone, copy terraform.tfvars.example to terraform.tfvars, set your email, then terraform init && terraform apply. The endpoint list lives in variables.tf — swap in the services you actually care about and re-apply.