Two live public surfaces — the analytical site and the operational dashboard — both rebuilt every Monday by the same GitHub Actions cron.
Threat intelligence is one of those domains where the work is mostly plumbing. A feed exists, the data is real, the analyst questions are obvious — what's hot, where is it targeting, what shape are the indicators taking, is anything new this week. The hard part has never been the analysis; it's owning the pipeline that produces it, on a cadence, in public, without something quietly breaking and no one noticing for a month.
This is that pipeline. AlienVault OTX in at one end, two live public surfaces out the other — an Evidence.dev analytical site that publishes what the data means, and a Grafana Cloud dashboard that watches whether the pipeline itself is healthy. A weekly GitHub Actions cron orchestrates ingest → transform → analyse → publish → audit, every Monday at 09:00 UTC. The whole AWS footprint is Terraformed, the Grafana dashboard and alerts ship as JSON + YAML in git (no UI-edited state), and the only way anything reaches production Neon or production AWS is through that cron. This is the modern-data-stack successor to an earlier Splunk-based v1; the legacy surface is removed, and the new shape is AI / Data / Analytics Engineering.
01 // The Challenge
The v1 system worked — it processed hundreds of thousands of indicators and produced a working Splunk dashboard. What it didn't have was anything you could point a stranger at. The Splunk install was local, the dashboards were behind a license, and the LLM analysis output sat in a notebook. Nobody could verify the thing existed without me running it for them, and nothing about the pipeline was observable from outside the box it ran on.
The brief I set for myself for v2 was specific. Build the whole thing on a modern data stack — warehouse-native transforms, build-time static analytics, real operational observability with alerting. Publish two surfaces, one for analysis and one for operations, and make both of them public. Run the cadence as a single weekly cron, version-controlled, deployable from an empty AWS account with one terraform apply and an OIDC trust policy. And replace the bolted-on LLM step with a swappable analyst layer that any of five providers can drive behind the same env var. No SaaS bills for hosting, no static AWS keys anywhere, and every Grafana panel and alert rule has to live in git the same way the Terraform does.
02 // The Stack
Each piece earns its place by solving a specific problem at the boundary it owns. There's no Spark cluster because there's no scale that needs one; there's no Airflow because GitHub Actions is already the single source of truth for "when does this run."
- Neon — serverless Postgres reached through the pgbouncer-pooled endpoint. Free tier, postgres 17, scale-to-zero. Three schemas:
raw(the landing zone),marts(dbt's output),pipeline(operational tables — watermark state and the run-audit log). - dbt Core — Postgres adapter, in its own isolated Python environment with its own
pyproject.toml, separate from the app env. Standard three-tier graph: staging → intermediate → marts. Nine marts published; every model has schema tests, selected models have data tests,dbt buildruns models and tests in one pass and feeds the result into the audit row. - Evidence.dev — v40 on Node 20 LTS (pinned in
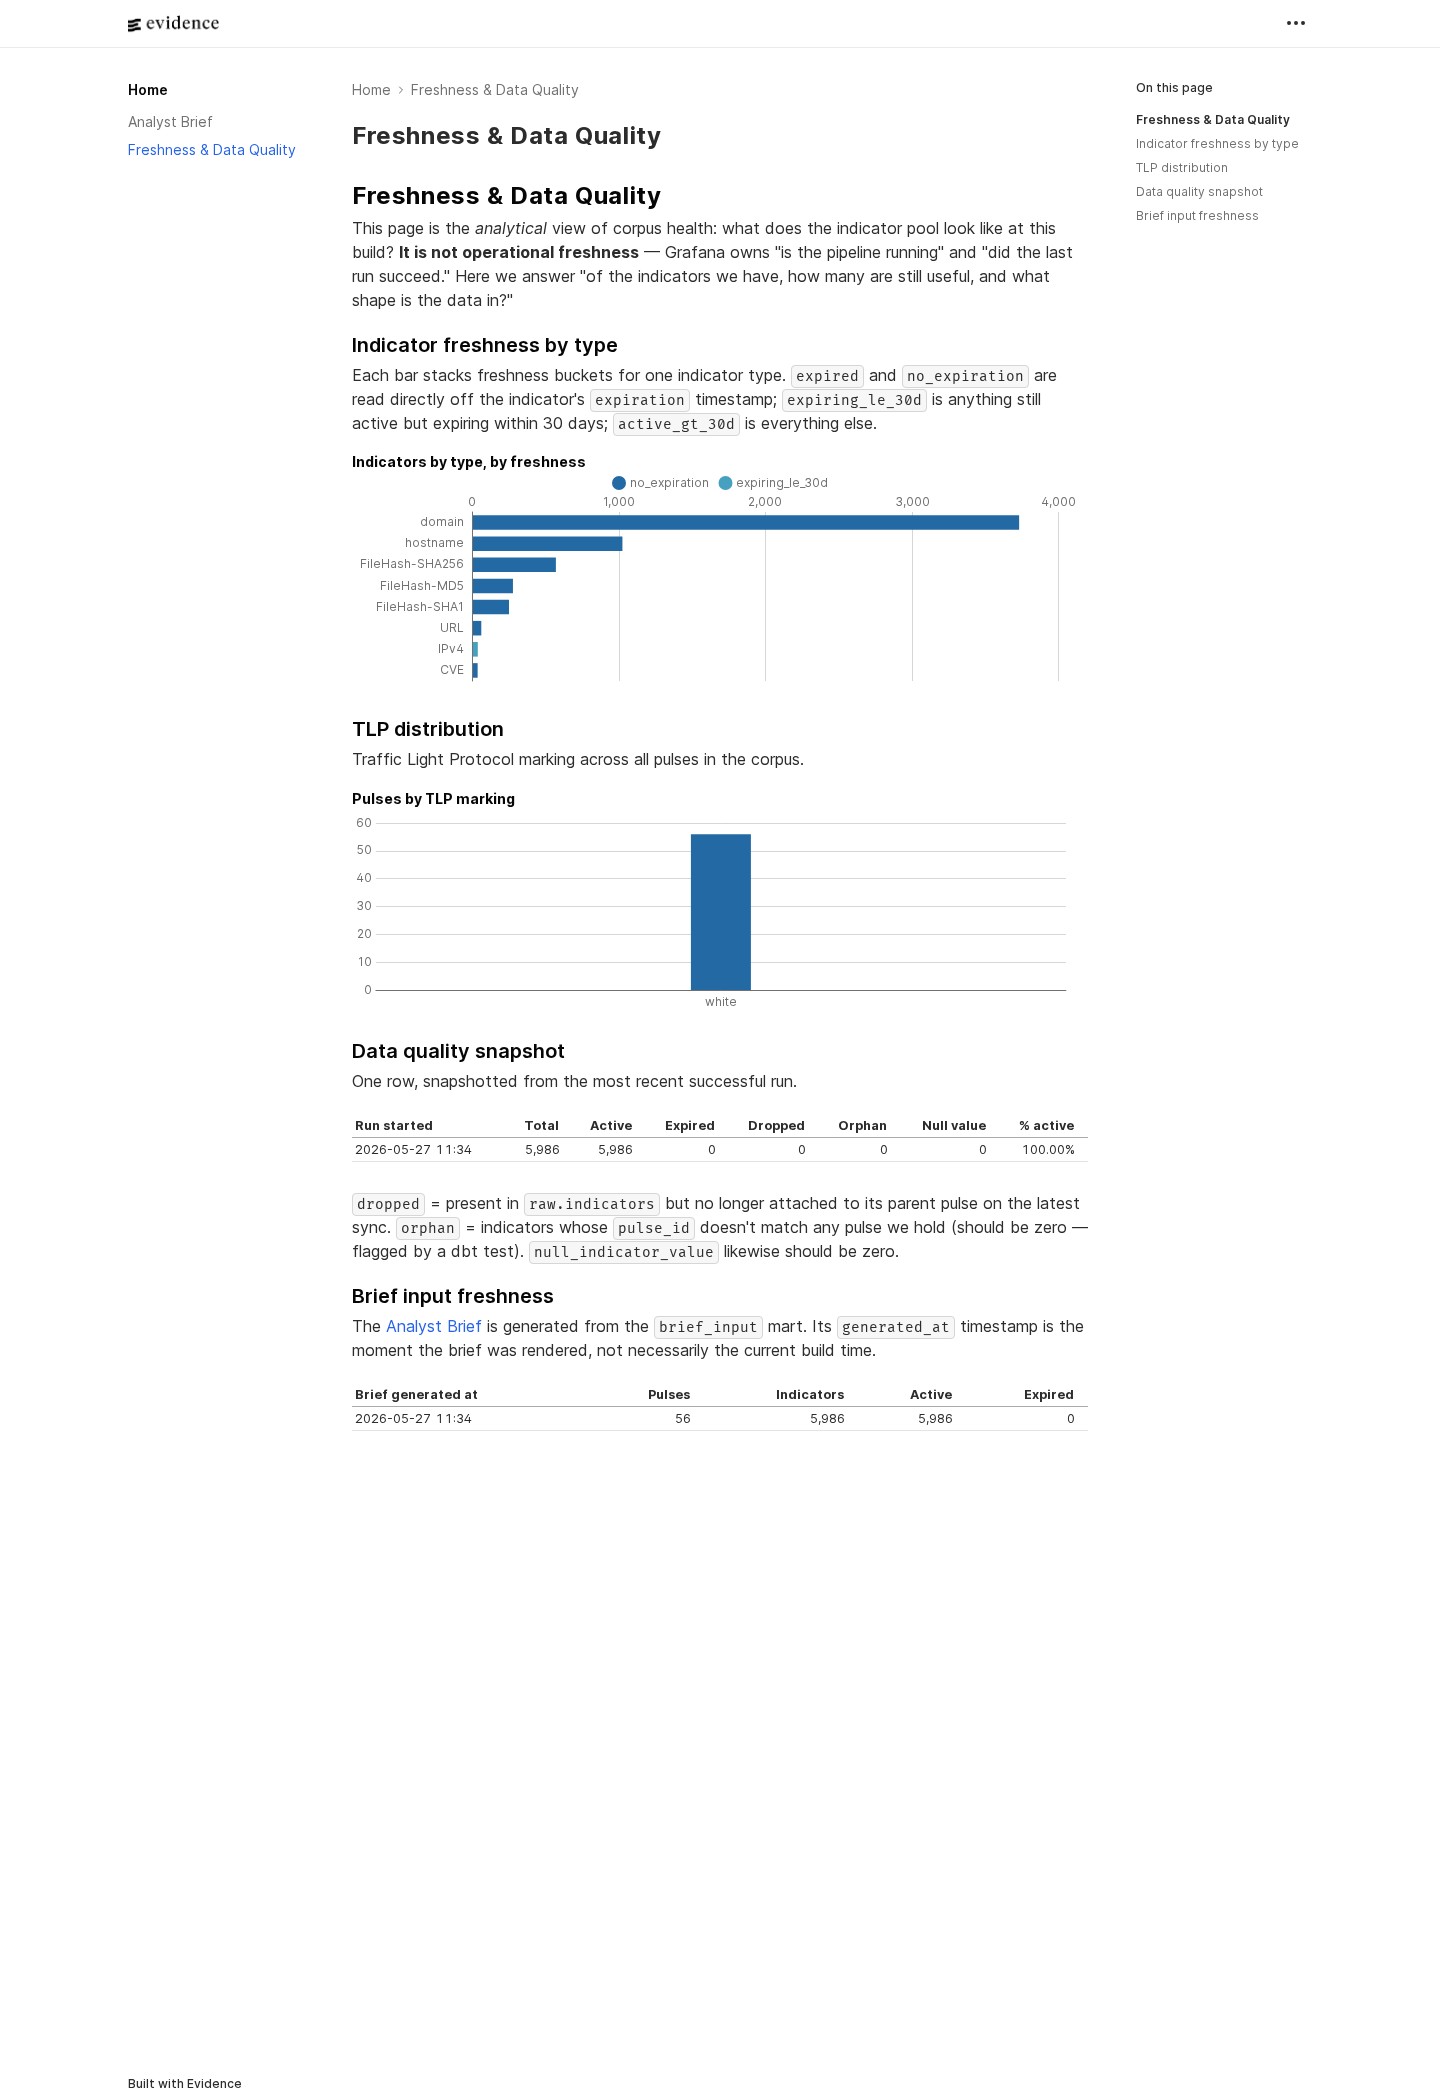
reporting/.nvmrc). Queries Neon at build time, bakes results into a static site, ships to S3 + CloudFront. No live database connection from the published surface. Three pages today — home, analyst brief, freshness & data quality. - Grafana Cloud — free tier. The dashboard (five panels) and alerts (four rules) live in
monitoring/asdashboard.jsonandalerts.yamland are provisioned via Grafana's HTTP API. No clicking around the UI; if a panel changes, it changes in a commit. - Claude as the production primary for the analyst brief, with Grok / GPT / Gemini / local Ollama all swappable behind one env var (
ANALYSIS_PRIMARY_PROVIDER). Any two providers can render side-by-side. The code default is local Ollama so dev and CI runs without any cloud API keys. - Python 3.12, managed by
uvwith the lockfile as the source of truth, plus pandas for the in-memory transform and theOTXv2SDK for the feed itself. - Terraform — S3 + Origin Access Control + CloudFront + ACM + Route 53 + the GitHub OIDC provider + the IAM deploy role, end-to-end. The OIDC provider is a
datalookup so the same code applies cleanly whether the AWS account already has one or not. - GitHub Actions — two workflows.
ci.ymlruns lint, type-check, tests, gitleaks, dbt build+test, Evidence build, andterraform validateon every push.pipeline.ymlruns the weekly cron and manual dispatch — and it is the only mechanism that writes to production Neon or deploys to AWS. - Makefile as the single source of truth for stage commands. Every stage is reproducible locally with the same
maketarget the cron invokes —make ingest,make transform,make analysis,make report. Local and CI literally run the same commands. - ruff · mypy · pytest · pre-commit — strict mypy, ruff on lint+format, gitleaks on every push.
03 // Architecture Overview
                            AlienVault OTX
                                  │  (incremental pull, modified_since watermark)
                                  ▼
                  ┌──────────────────────────────────┐
                  │  Python ETL  ·  uv  ·  3.12      │
                  │  extract → transform → upsert    │
                  └──────────────┬───────────────────┘
                                 ▼
            ┌─────────────────────────────────────────────┐
            │              Neon Postgres                  │
            │  raw  ─►  dbt (9 marts)  ─►  marts          │
            │                              │              │
            │             pipeline.runs  ◄─┘              │
            │             pipeline.state                  │
            └──────────────┬──────────────┬───────────────┘
                           │              │
                  (grafana_ro RO role)    │ (build-time queries)
                           ▼              ▼
                  ┌─────────────────┐  ┌─────────────────────┐
                  │ Grafana Cloud   │  │ Evidence.dev        │
                  │ 5 panels        │  │ Static site build   │
                  │ 4 alert rules   │  │   │                 │
                  │ (JSON + YAML)   │  │   ▼ via OIDC role   │
                  └─────────────────┘  │ S3 + CloudFront     │
                                       │ ACM + Route 53      │
                                       └─────────────────────┘

  Orchestrated by GitHub Actions: ci.yml (every push) + pipeline.yml (Mon 09:00 UTC).
  Single source of truth for stage commands is the Makefile — local == CI, byte-for-byte.
The annotated companion to this diagram lives in the repo's docs/architecture.md — Mermaid version of the same flow, per-component notes, and the trust-boundary table.
04 // The Weekly Run
Every Monday at 09:00 UTC, .github/workflows/pipeline.yml walks five stages. Each stage writes an audit row to pipeline.runs when it finishes, so Grafana can plot the run timeline and the freshness alert can fire if a run goes missing.
INSERT … ON CONFLICT into raw. The watermark only advances on success, so failed runs are replayable.reporting/pages/analyst-brief.md for Evidence to pick up.pipeline.runs. Grafana reads this through the read-only role; failure trips the ctp-run-failure alert.make target the cron invokes verbatim. make ingest on a laptop runs the same code path as the Monday job. No drift, no "works on CI."05 // Two Surfaces, Two Audiences
The split between Evidence.dev and Grafana Cloud is the design decision the whole pipeline is shaped around. Both surfaces query the same Neon database, but they answer fundamentally different questions for fundamentally different readers, so they ship as separate products with separate update cadences.
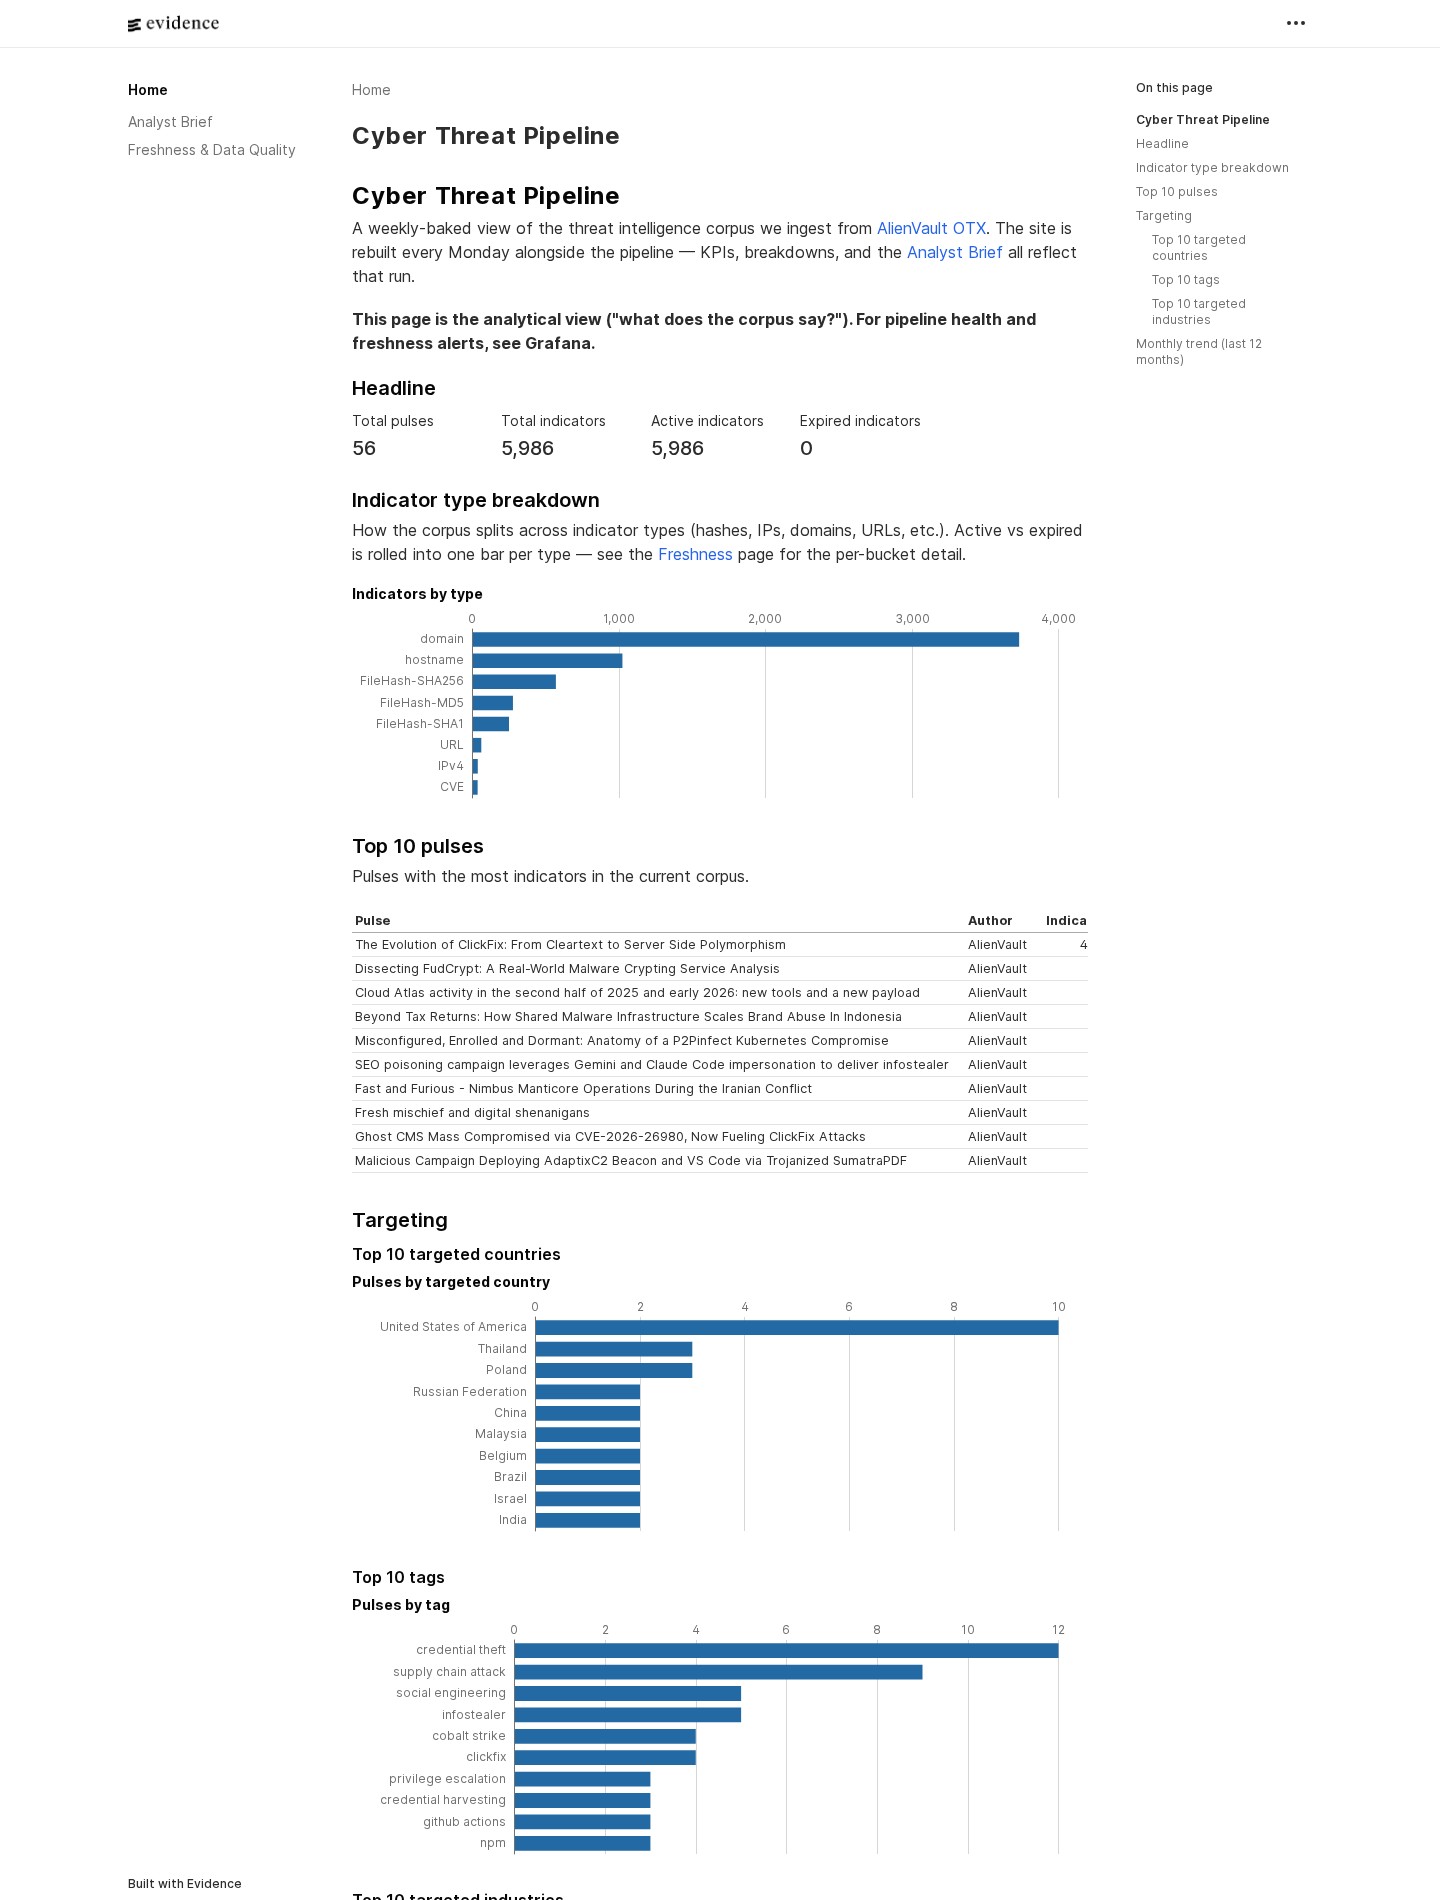
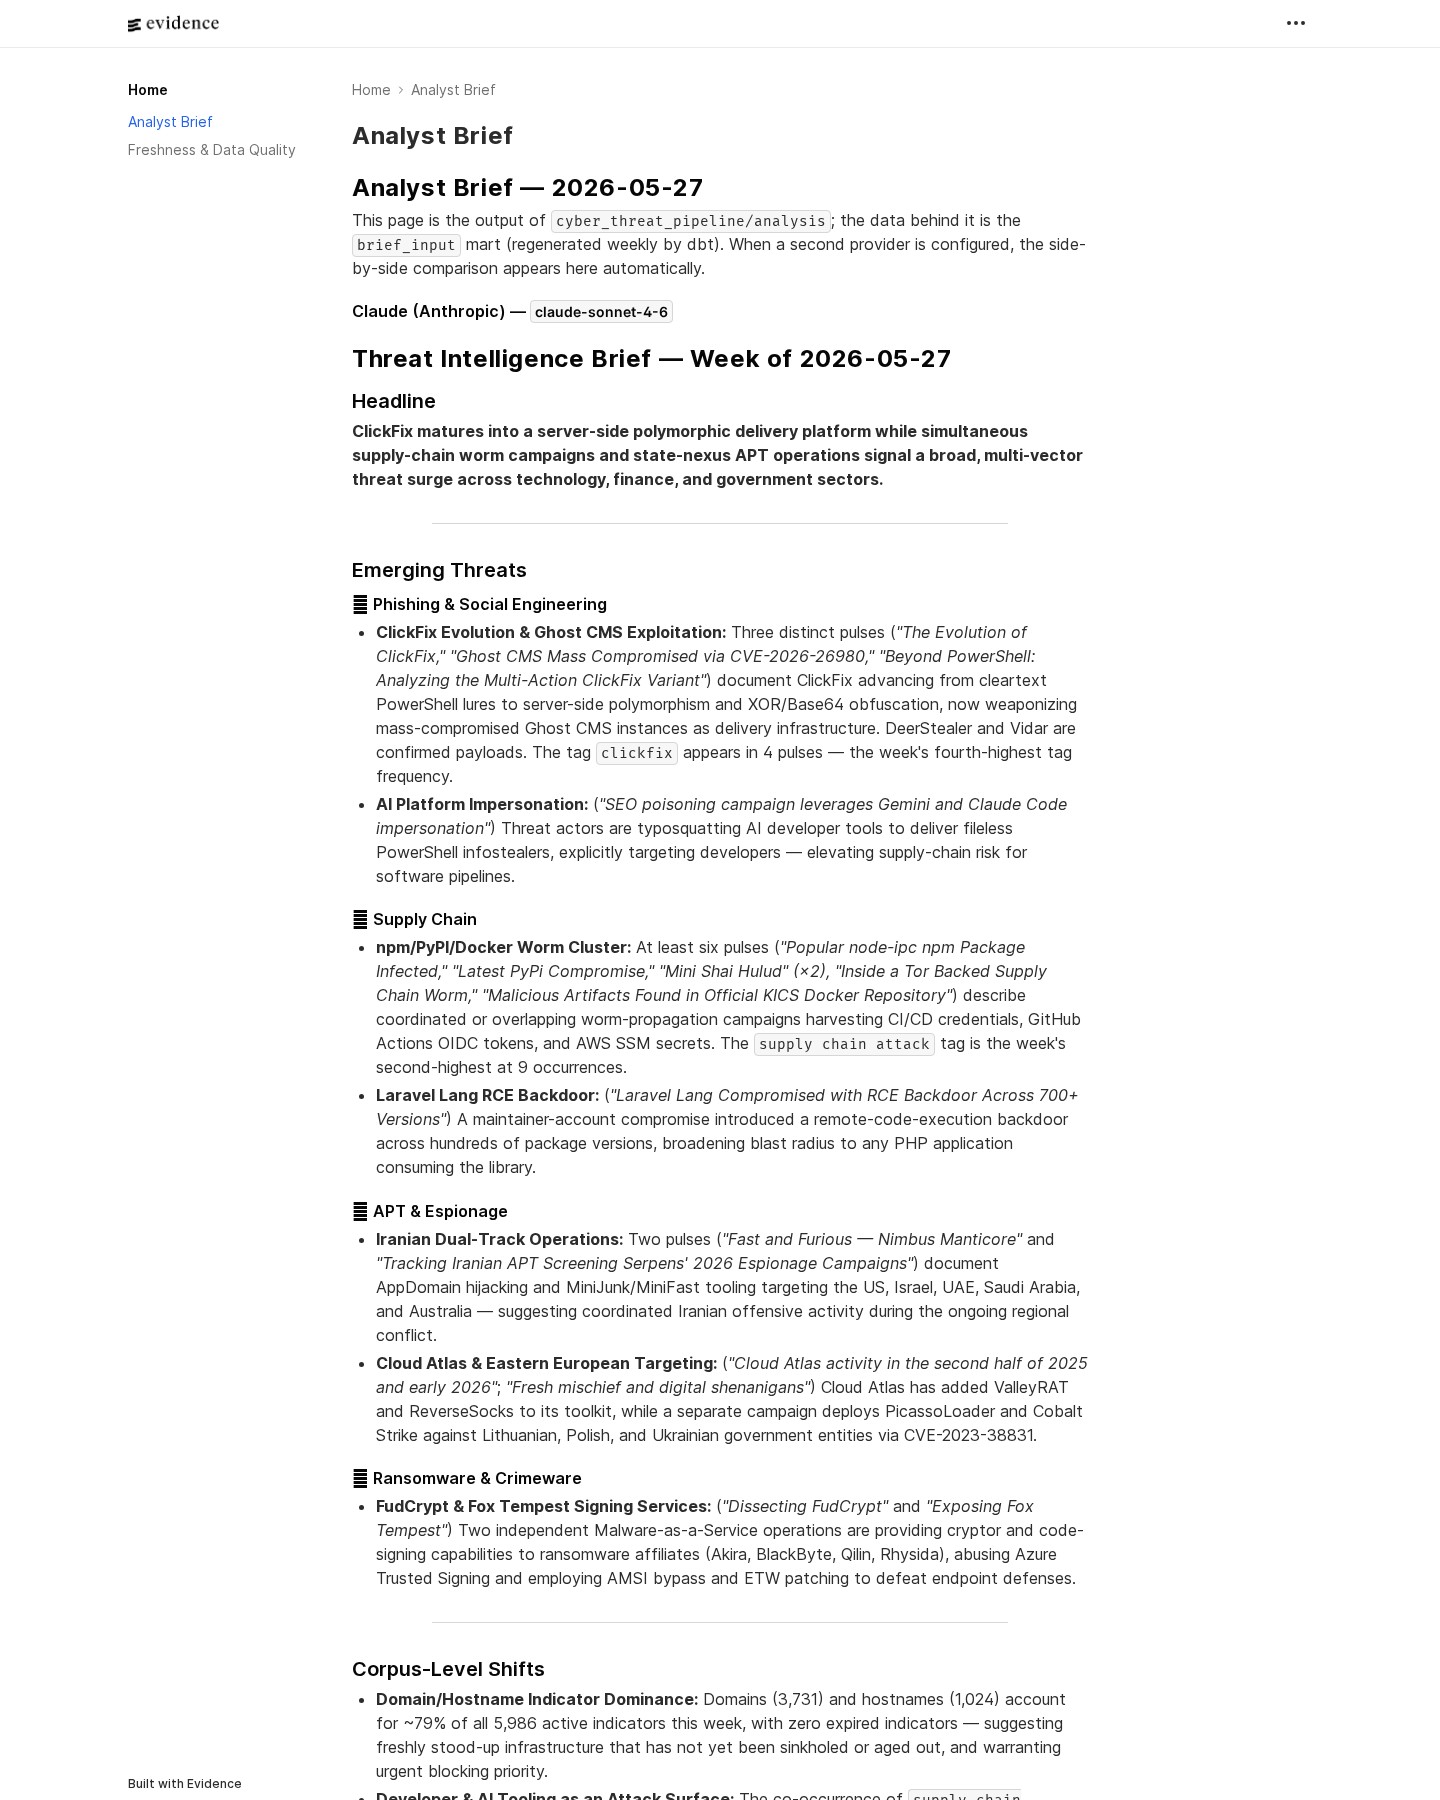
Evidence.dev — the analysis. Point-in-time, narrative, recruiter-facing. "What does the threat data say this week — what's trending, where is it targeting, what new pulses appeared." Queries run at build time against the dbt marts, results are baked into HTML, the published site is static. No live database connection from anything a visitor's browser loads. Three pages today: corpus overview, the LLM-generated analyst brief, and freshness & data-quality.
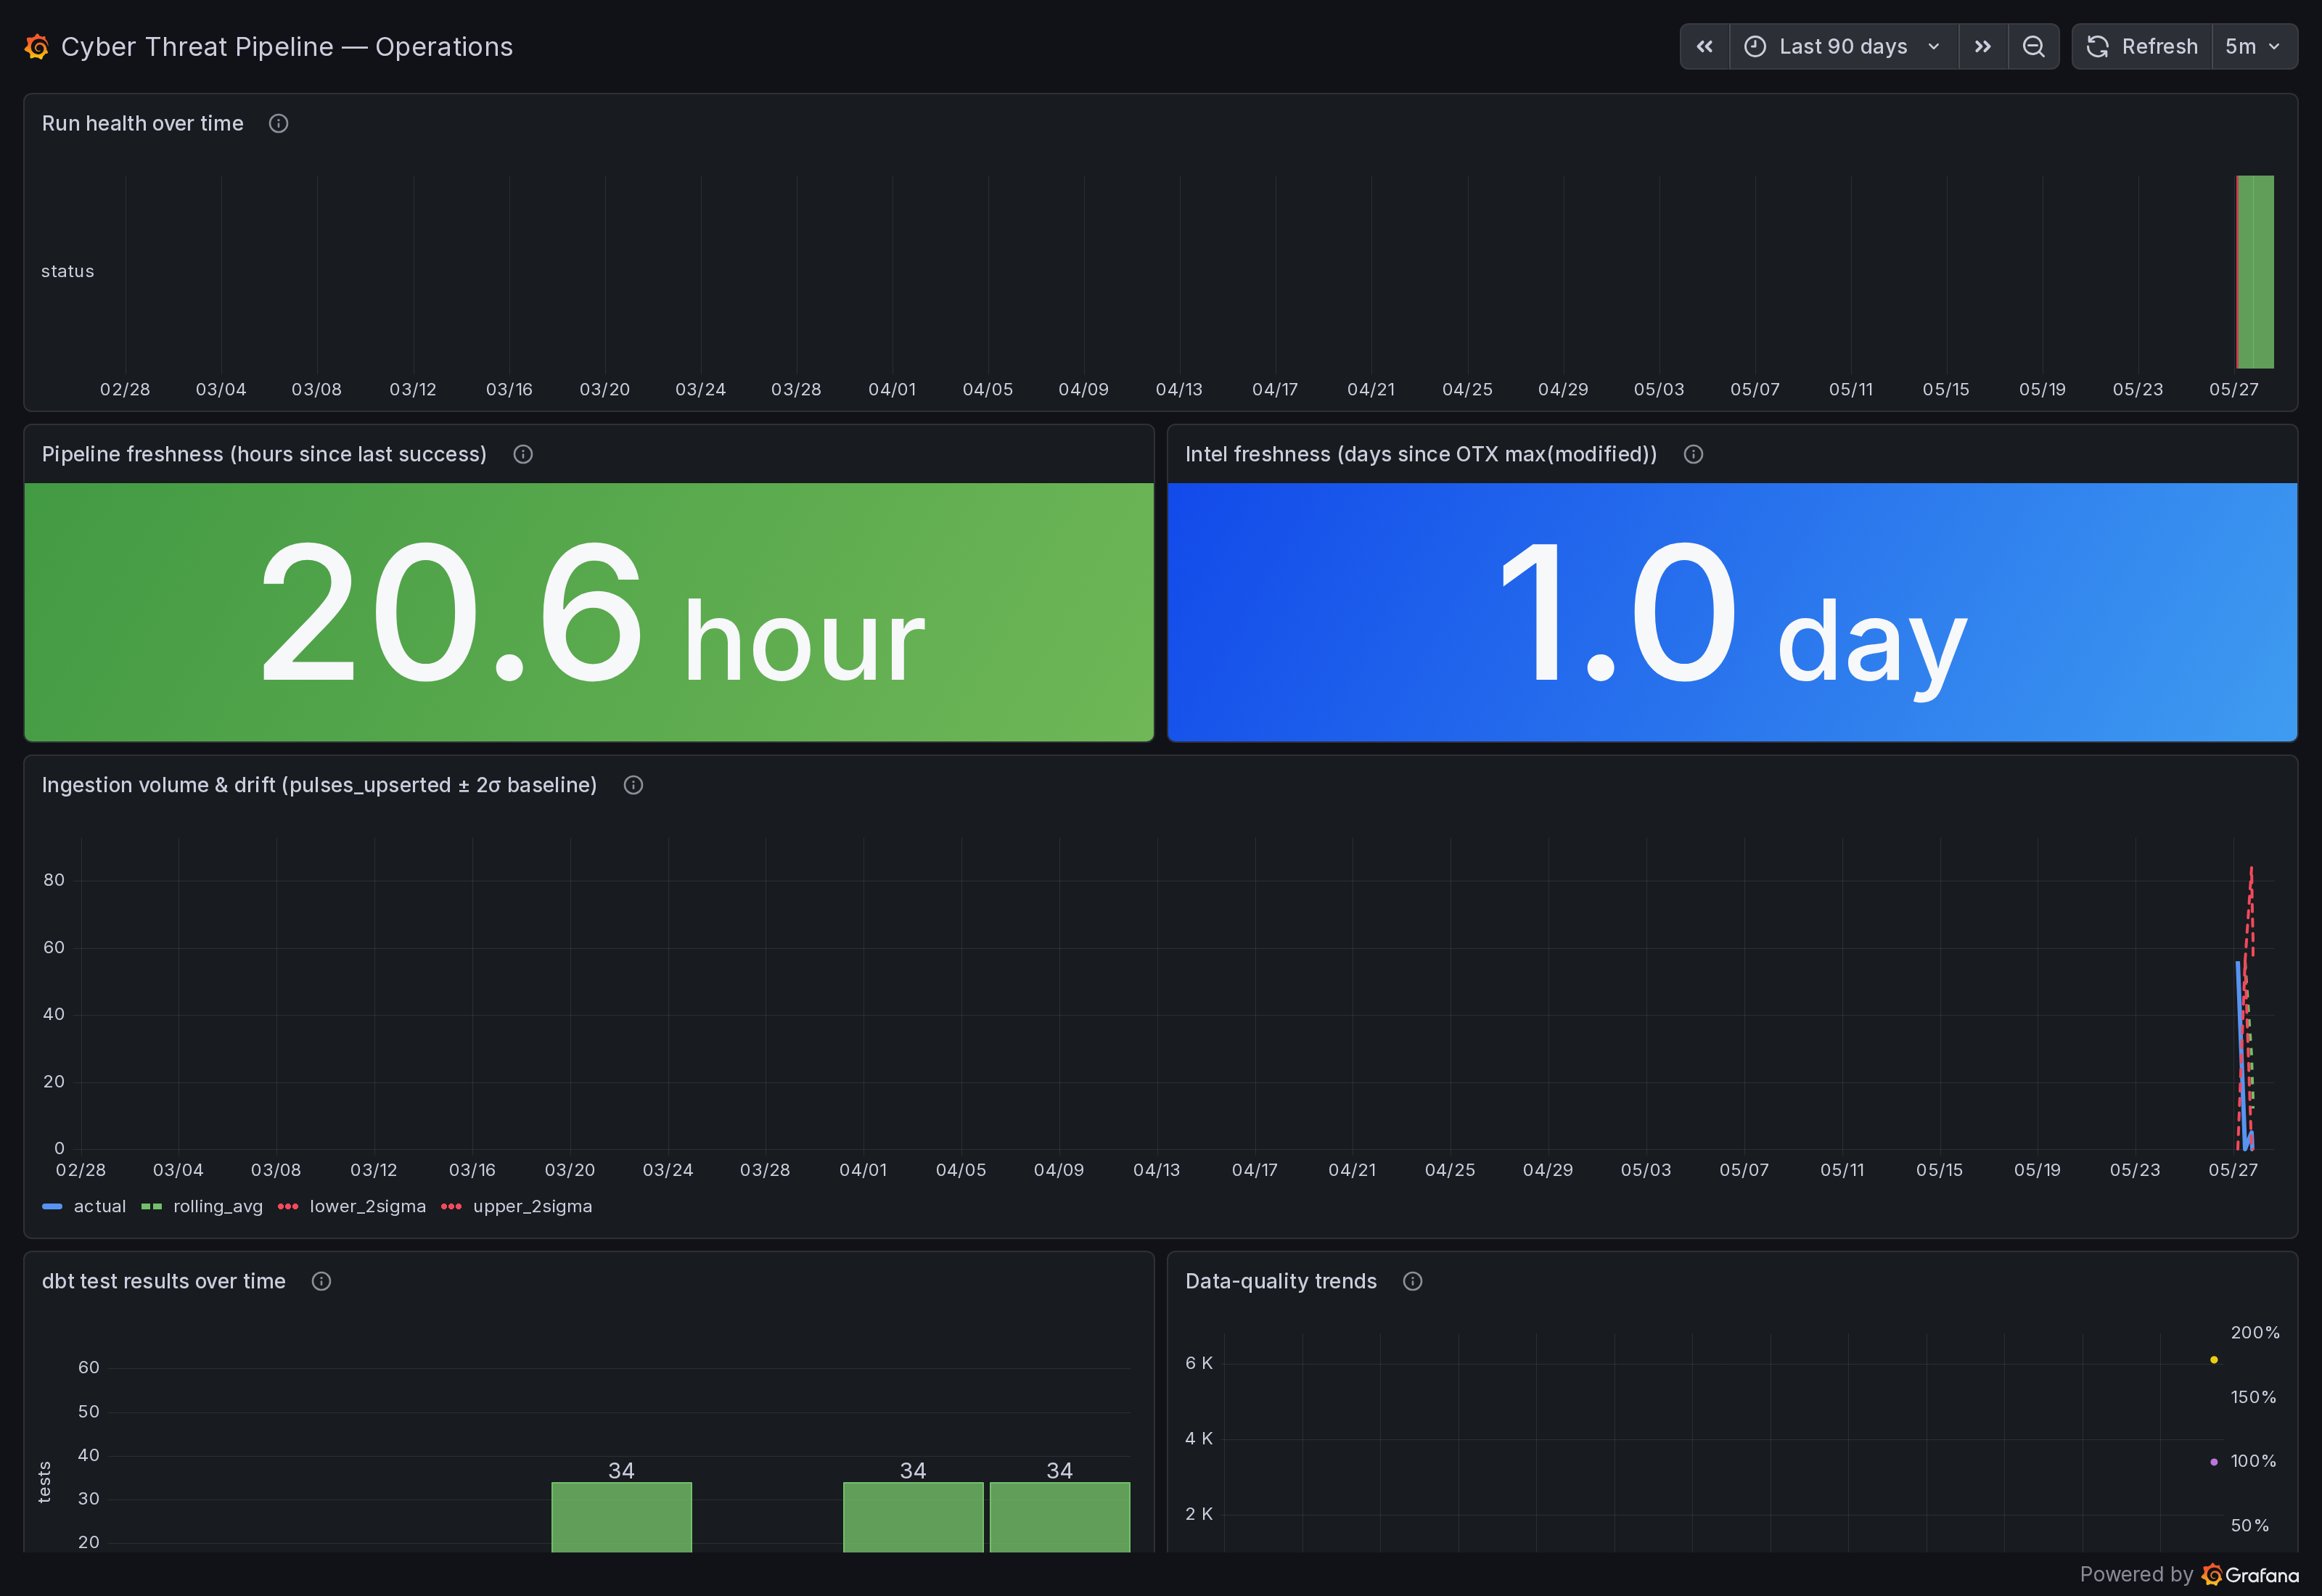
Grafana Cloud — the operations. Time-series, live, oncall-facing. "Is the pipeline healthy and can I trust the data the analyst site is built on." Five panels — run status timeline, rows-ingested-per-run, dbt test pass rate, freshness versus SLA, error log. Four alert rules — run failure, stale data, dbt test regression, ingest row-count drop — each evaluated every 900 seconds and routed through Grafana's contact points. Backed by a read-only Neon role scoped to marts and pipeline.runs only.
The litmus test for which surface a new panel or page belongs on is simple. Does it answer "what does the data mean"? It goes on Evidence. Does it answer "is the pipeline healthy and can I trust the data asset"? It goes on Grafana. The two surfaces never argue about who owns a chart because the question they answer is on a different axis.
06 // End-to-End Ownership
The whole AWS footprint is Terraformed — S3 bucket, Origin Access Control, CloudFront distribution, ACM certificate, Route 53 record, GitHub OIDC provider, IAM deploy role. terraform apply in an empty AWS account stands the whole thing up. The OIDC provider is a data lookup, not a resource, so the same code applies cleanly whether the account already has a GitHub OIDC provider or not — no race against an existing one, no manual import.
The Grafana dashboard and alerts are provisioned the same way the Terraform is — code in, no UI clicks. dashboard.json and alerts.yaml get pushed through Grafana's HTTP API at install time, with a <NEON_RO_UID> placeholder in the alerts substituted at provisioning time from the datasource API response. Any operational change shows up in git diff — not as a surprise during an incident.
The repo layout reflects the ownership split:
cyber_threat_pipeline/   Python app (core · ingestion · analysis)
sql/                     Schemas (raw · marts · pipeline) + grafana_ro role
transform/               dbt Core (isolated env) · 9 marts · tests
reporting/               Evidence.dev · 3 pages · Node 20 LTS
monitoring/              Grafana dashboard + alerts as code (no UI state)
infra/                   Terraform · S3 + CloudFront + ACM + R53 + OIDC role
tests/                   pytest
docs/                    architecture.md (annotated) + screenshots/
.github/workflows/       ci.yml (6 checks) + pipeline.yml (weekly cron)
Makefile                 single source of truth for stage commands
The Makefile is the contract between the laptop and the cron. Every CI step and every cron stage invokes make <target>; there's no shell-script bypass and no in-workflow command that doesn't exist as a make target. That's the invariant that makes "reproduce the failure locally" a one-line thing instead of an archeology project.
07 // Security Posture
Least-privilege observability. Grafana Cloud connects to Neon as grafana_ro, a read-only role scoped to marts and pipeline.runs. It can't see raw, it can't see pipeline.state, and it can't write anything. The application role used by ingest, dbt, and the analyst is a separate identity that only runs from inside the GitHub Actions cron — local dev is always against a personal Neon branch.
OIDC-only AWS access. The publish stage assumes an IAM role via GitHub's OIDC provider. There are no long-lived AWS keys in repo secrets, no exported access keys on a developer machine, no aws configure step in CI. The trust policy is pinned to repo:<owner>/<repo>:ref:refs/heads/main and repo:<owner>/<repo>:environment:production — a PR branch can't assume the role and a workflow that isn't gated on the production environment can't assume it either.
Boundaries are explicit. The Evidence build queries Neon at build time and bakes results into HTML — the published site never holds a live database connection. The LLM providers never see the database directly; the analyst step fetches data first and sends a synthesized prompt. _private/ content is gitignored, CLAUDE.md is gitignored, .env is gitignored, and gitleaks runs on every push. The four boundaries are tabulated in docs/architecture.md#trust-boundaries.
08 // Results
terraform apply stands it up from zero. No console-edited resources.ref:refs/heads/main + environment:production. No exported keys on any laptop or in any repo secret._invoke_llm helper. Any two render side-by-side on the same input.dashboard.json + alerts.yaml in git, provisioned via Grafana's HTTP API. No UI-edited state — operational drift shows up in git diff.09 // What I Took From It
- Two surfaces beat one dashboard with too many panels. The Evidence / Grafana split forces every chart to pick a side — "what does the data mean" or "is the pipeline healthy" — and the answer is rarely ambiguous. A dashboard that tries to do both ends up serving neither audience well.
- The Makefile is the contract. Picking
makeas the single source of truth for stage commands meant local-dev and CI run byte-identical code paths. The first time a stage failed in CI and I reproduced it locally with one command, the design paid for itself. - Dashboards and alerts belong in git. A Grafana panel that exists in the UI and not in
dashboard.jsonis a panel waiting to disappear in a workspace reset. Once the dashboard is provisioned by API from a JSON file, every change is a code review, every diff is auditable, and "what changed last Tuesday" is agit logquestion. - OIDC closes a class of incident. No static AWS keys means no rotated-secret panic, no exposed key in a commit, no "we think it was leaked, who knows." Trust-policy pinning to a specific ref + environment makes the blast radius of a compromised workflow finite. The setup cost is one Terraform module; the recurring cost is zero.
- The free tier is generous if you respect it. Neon serverless Postgres, Grafana Cloud free tier, CloudFront's free egress allowance for a low-traffic surface — the whole platform runs for the cost of the Route 53 hosted zone and the small S3 footprint. Picking infrastructure that scales down mattered more than picking infrastructure that scales up.
- Swappable LLM providers earn their keep on day one. Putting every model behind a single
_invoke_llmhelper and anANALYSIS_PRIMARY_PROVIDERenv var means switching from Claude to Grok to local Ollama is a one-line change. Pricing shifts, model deprecations, and side-by-side comparisons all become trivial instead of refactor-shaped.
10 // Try It
Both surfaces are live — cyber-intel.markandrewmarquez.com for the Evidence analytical site, and the public Grafana board for operational health. Both refresh every Monday by the cron in .github/workflows/pipeline.yml.
Source is at github.com/marky224/cyber-threat-pipeline — Python app, dbt project, Evidence pages, Grafana dashboard + alert JSON, Terraform for the full AWS footprint, the GitHub Actions workflows, and the architecture document. The repo is licensed under PolyForm Strict 1.0.0 — source-available for personal study and noncommercial evaluation; reuse needs prior written permission.
git clone https://github.com/marky224/cyber-threat-pipeline
cd cyber-threat-pipeline
make install      # uv sync (Python 3.12 dev env)
make lint         # ruff
make typecheck    # mypy
make test         # pytest

# Same targets the weekly cron invokes:
make ingest       # OTX → raw schema
make transform    # dbt build
make analysis     # LLM analyst brief
make report       # Evidence build + S3 + CloudFront