01 // Project Summary
Through a dataset provided by the LA County government, cities in LA County were grouped into clusters based on sociodemographic scores to develop benchmarks for each cluster. The goal: give policymakers a lens sharper than county-wide averages, so programs can be sized and targeted city-by-city.

02 // Introduction
LA County is one of the most diverse counties in the United States. Depending on where you stand, the environment can shift from Beverly Hills to Skid Row in a 20-minute drive. One-size-fits-all funding flattens that variance and leaves real need unmet. Clustering cities by sociodemographic signal surfaces natural groupings and lets local government allocate more precisely against each group's profile.
03 // Methods
Data source: A Portrait of Los Angeles County using the Human Development Index on the County open-data portal.
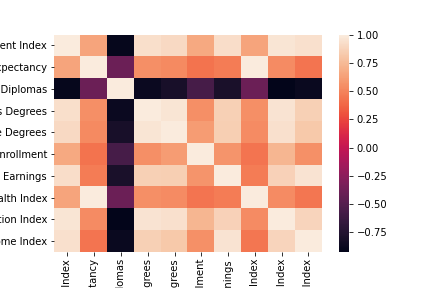
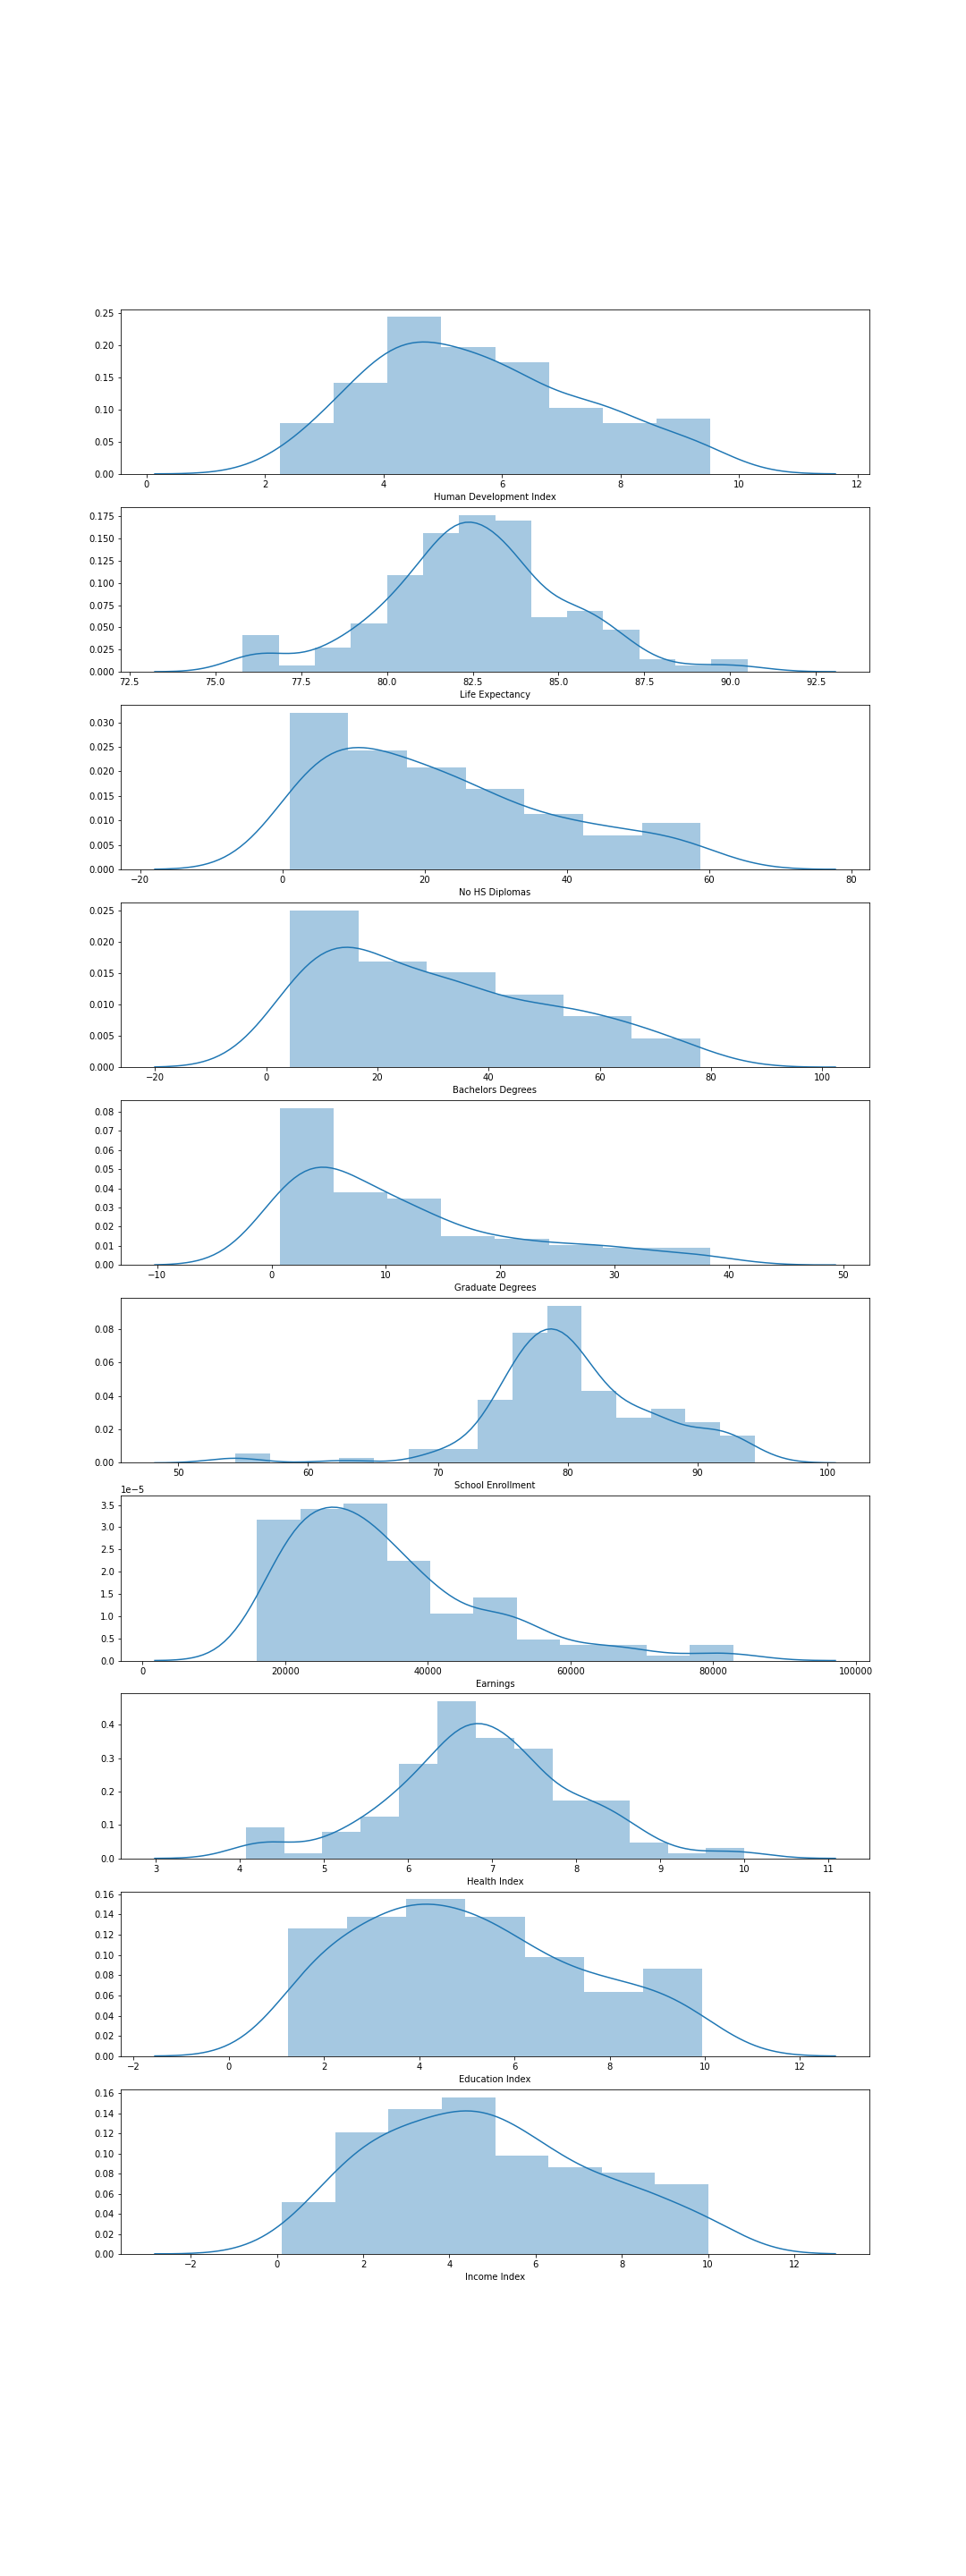
- EDA — heatmaps and histograms per feature to find redundant variables; index columns dropped for distribution overlap.
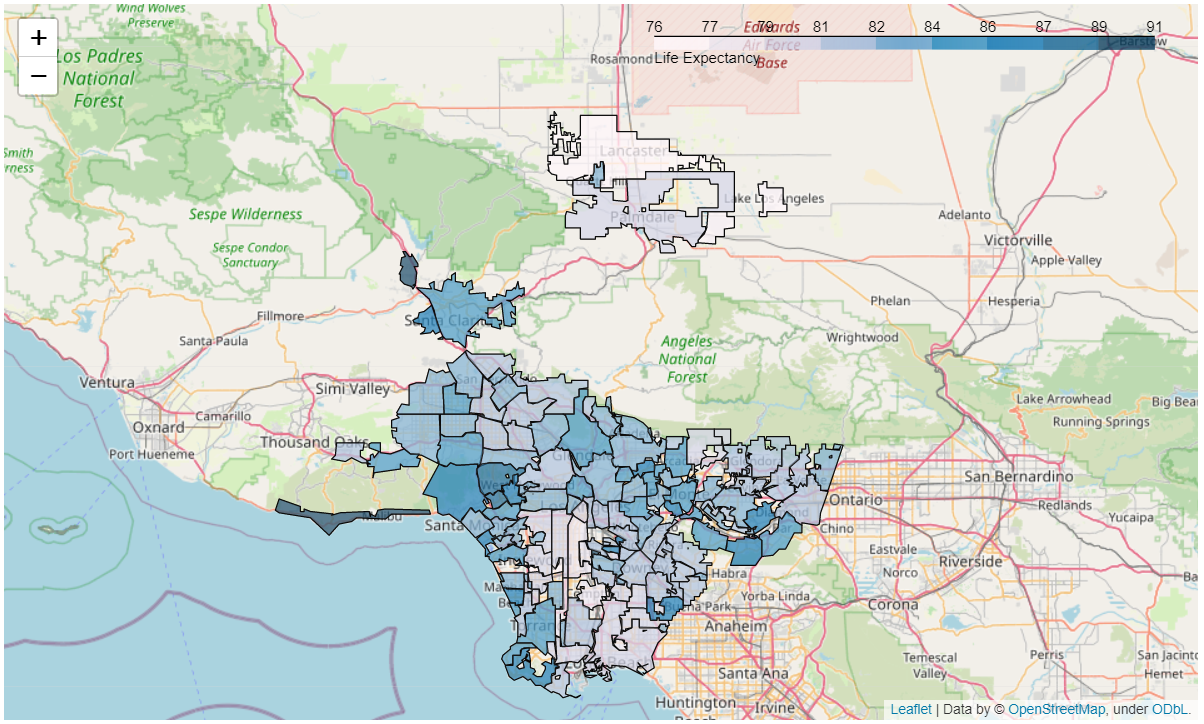
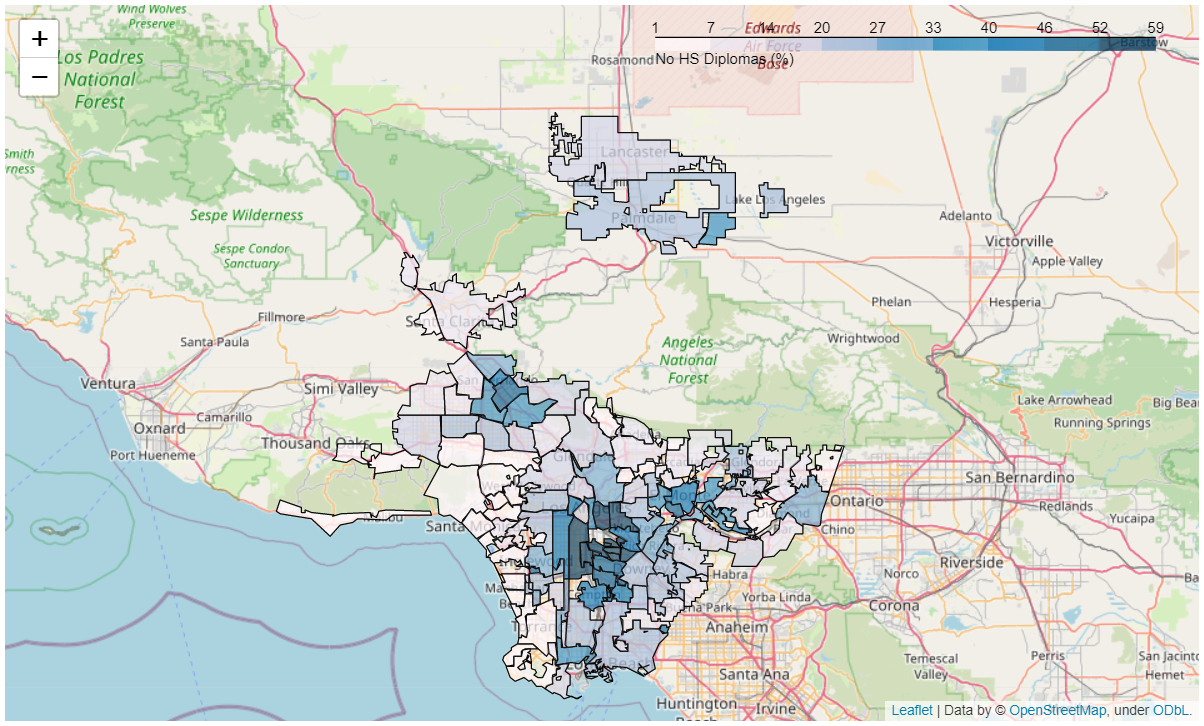
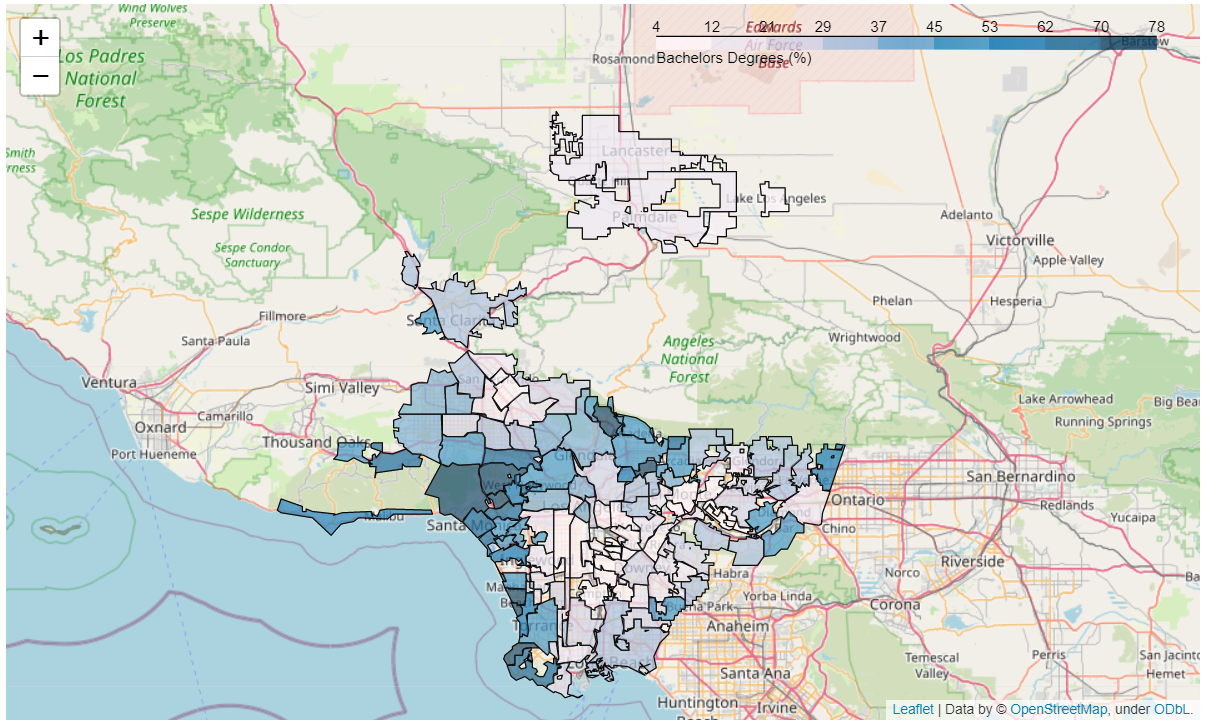
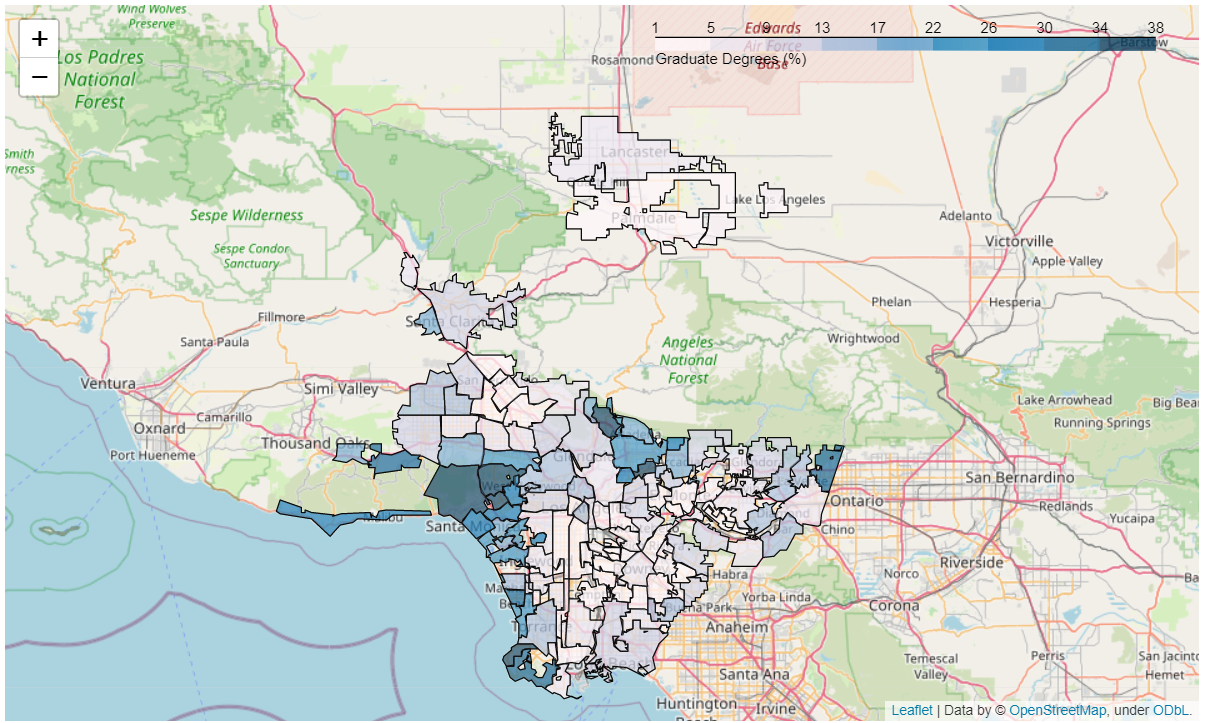
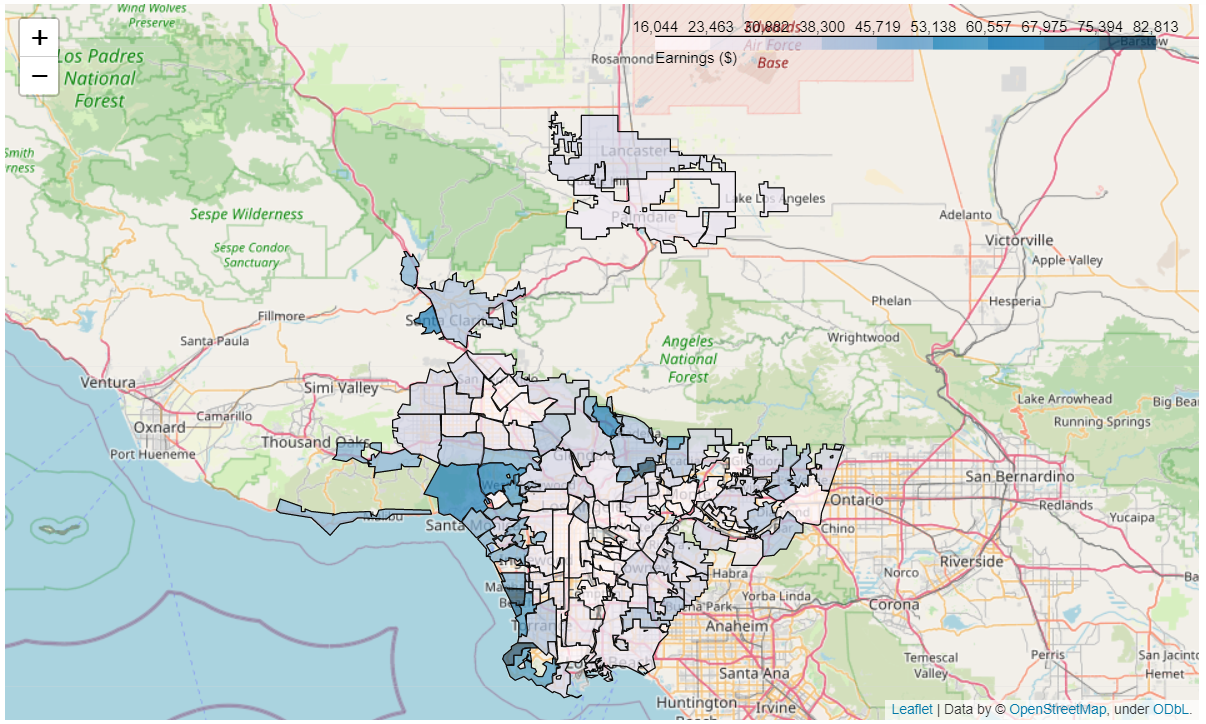
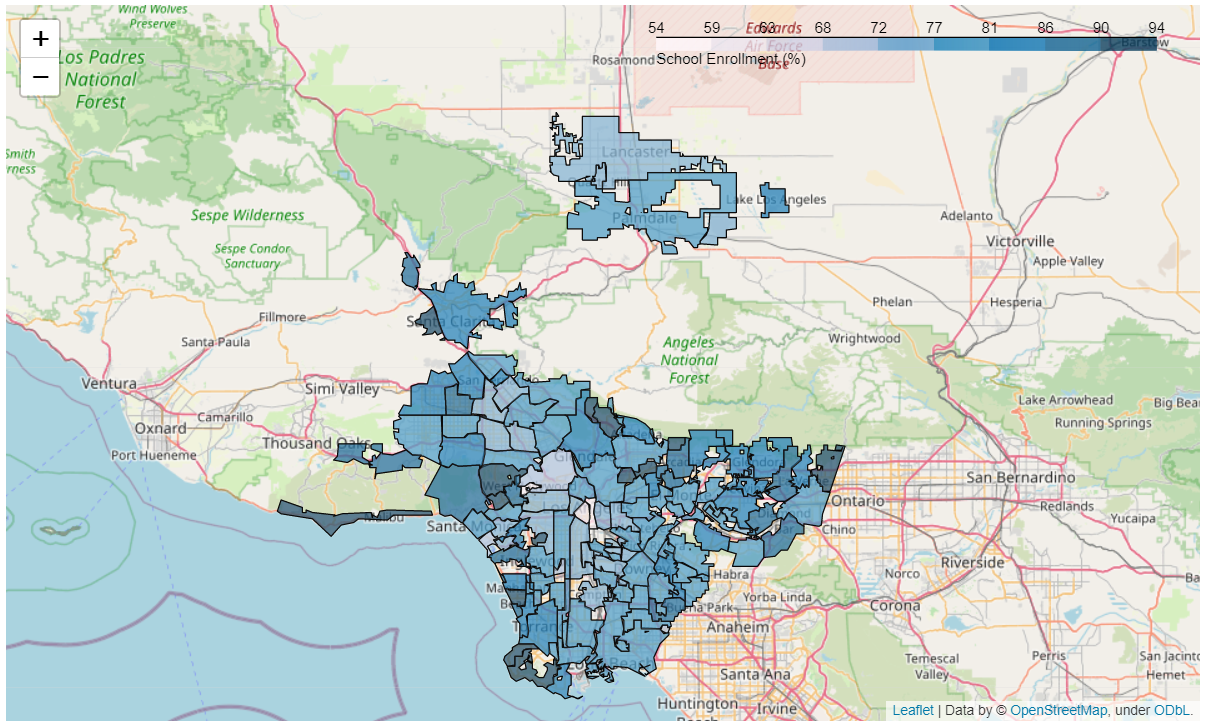
- GIS mapping — each feature mapped city-by-city for a visual sense of variance (life expectancy, education, earnings, school enrollment).
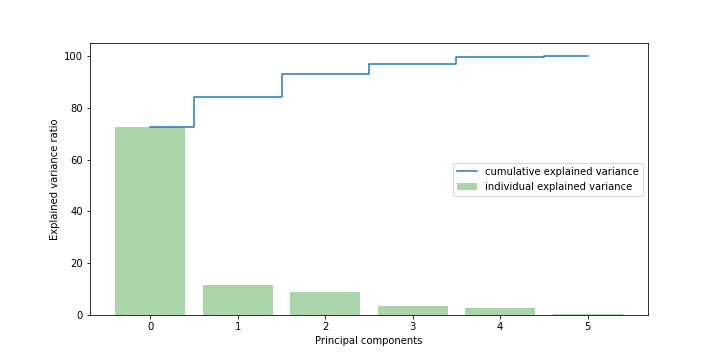
- PCA — principal component analysis to decide how many clusters capture the most variance.
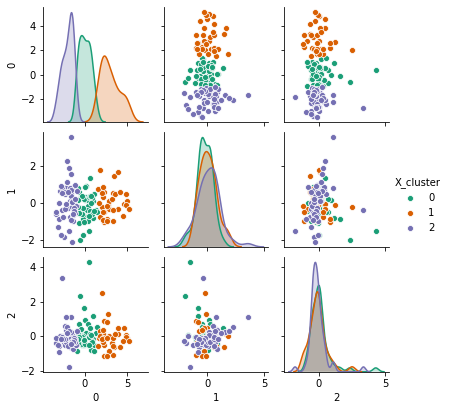
- K-Means — 3 clusters chosen; pairwise plots used to confirm the separation visually.
04 // Results
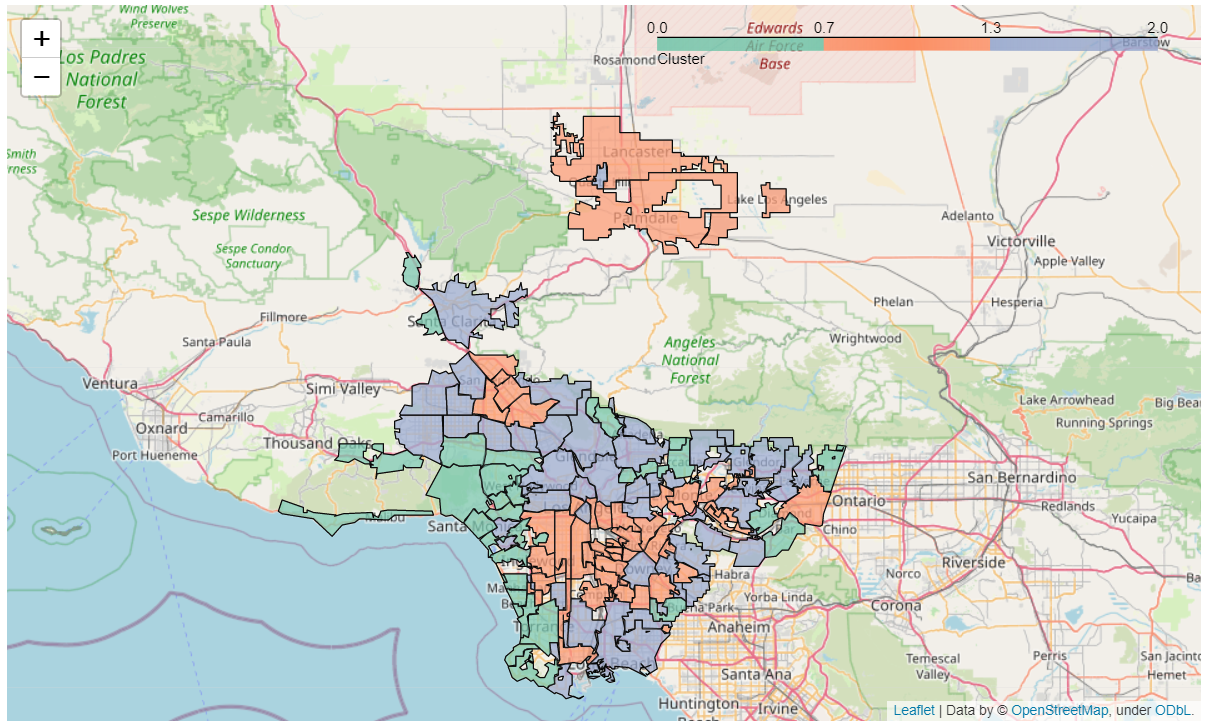
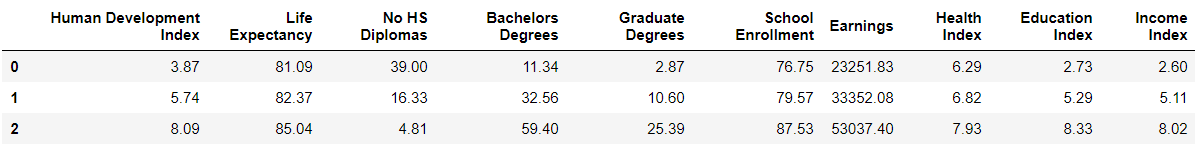
The three clusters were mapped back onto LA County for a visual read of the sociodemographic tiers, and per-cluster benchmarks were computed (average scores, representative cities). The result is a lightweight framework: any new LA-area program or grant can be reviewed against the cluster it's targeting, rather than a county-wide average that hides the disparities.