This is the v1 Splunk-era pipeline. The modern-data-stack rebuild — Neon + dbt + Evidence.dev + Grafana Cloud, with live public surfaces and a weekly cron — ships as a separate write-up.
01 // The Challenge
Threat intelligence platforms like AlienVault OTX serve up huge volumes of indicators of compromise — malicious IPs, URLs, domains, file hashes. Raw is easy. Actionable is the hard part. Analysts need the data shaped, filtered, and visualized before it's worth anything, and doing that by hand is expensive and error-prone.
The brief I set for myself: an end-to-end pipeline that collects, transforms, stores, visualizes, and interprets threat intel with as little human-in-the-loop as possible.
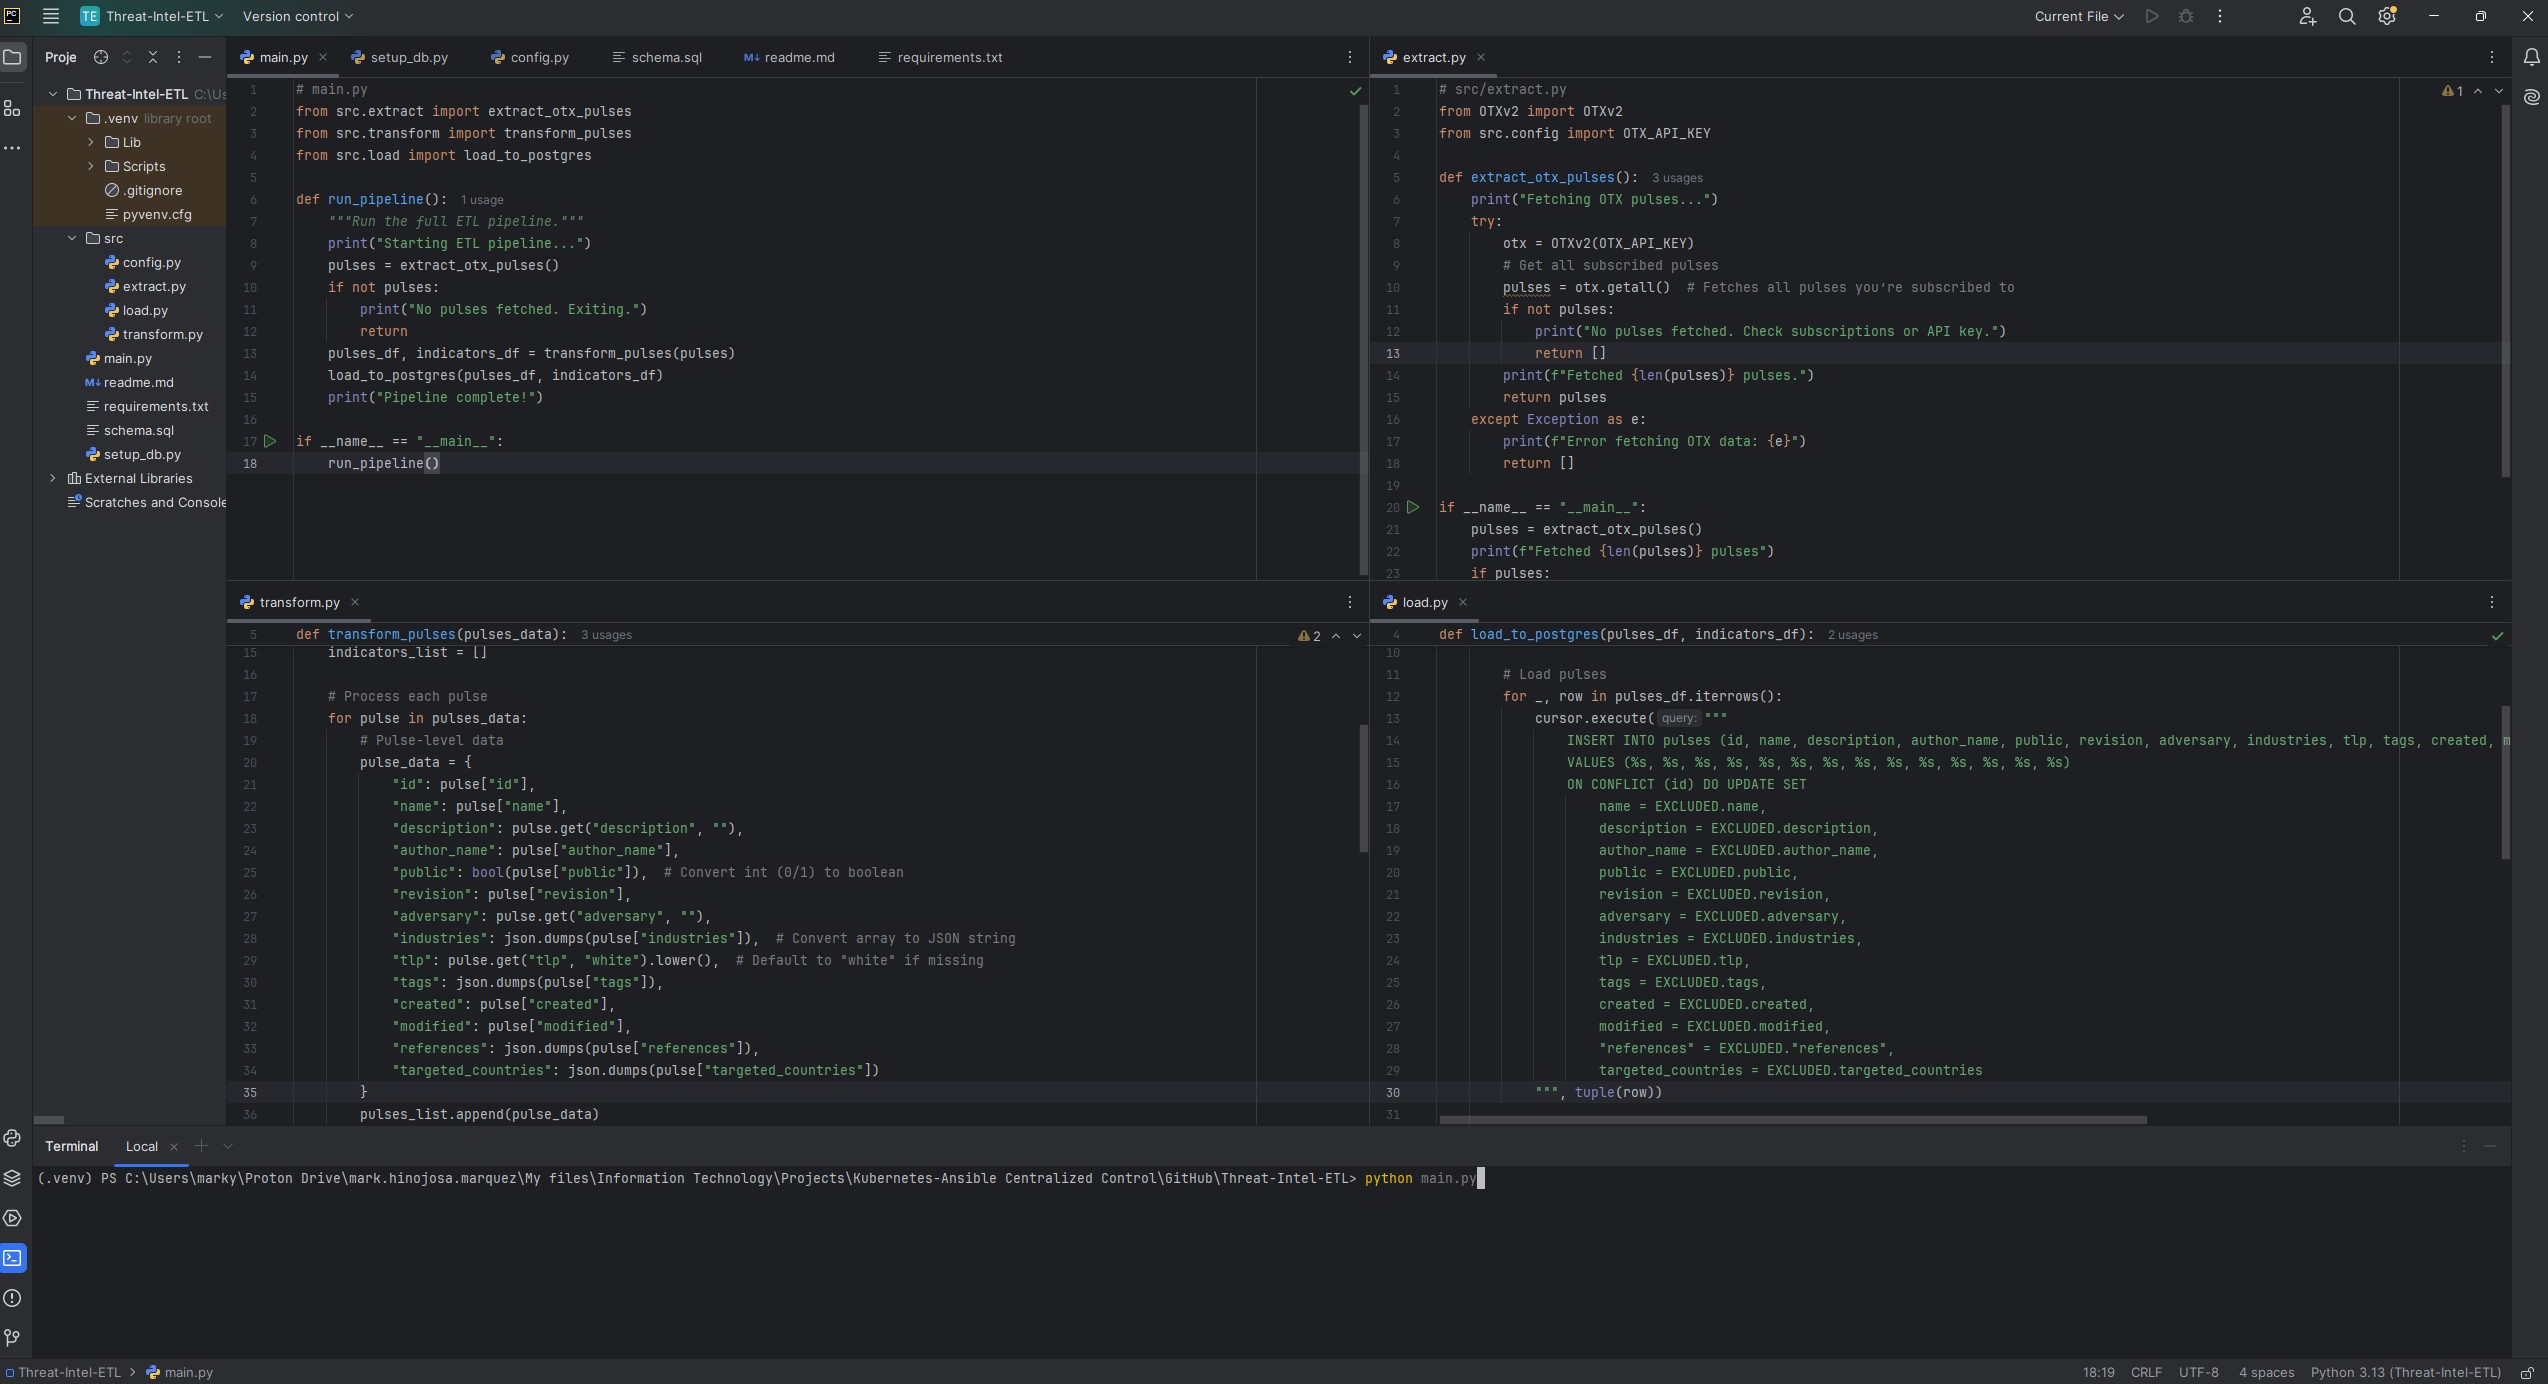
02 // The Pipeline
03 // The Splunk Dashboard
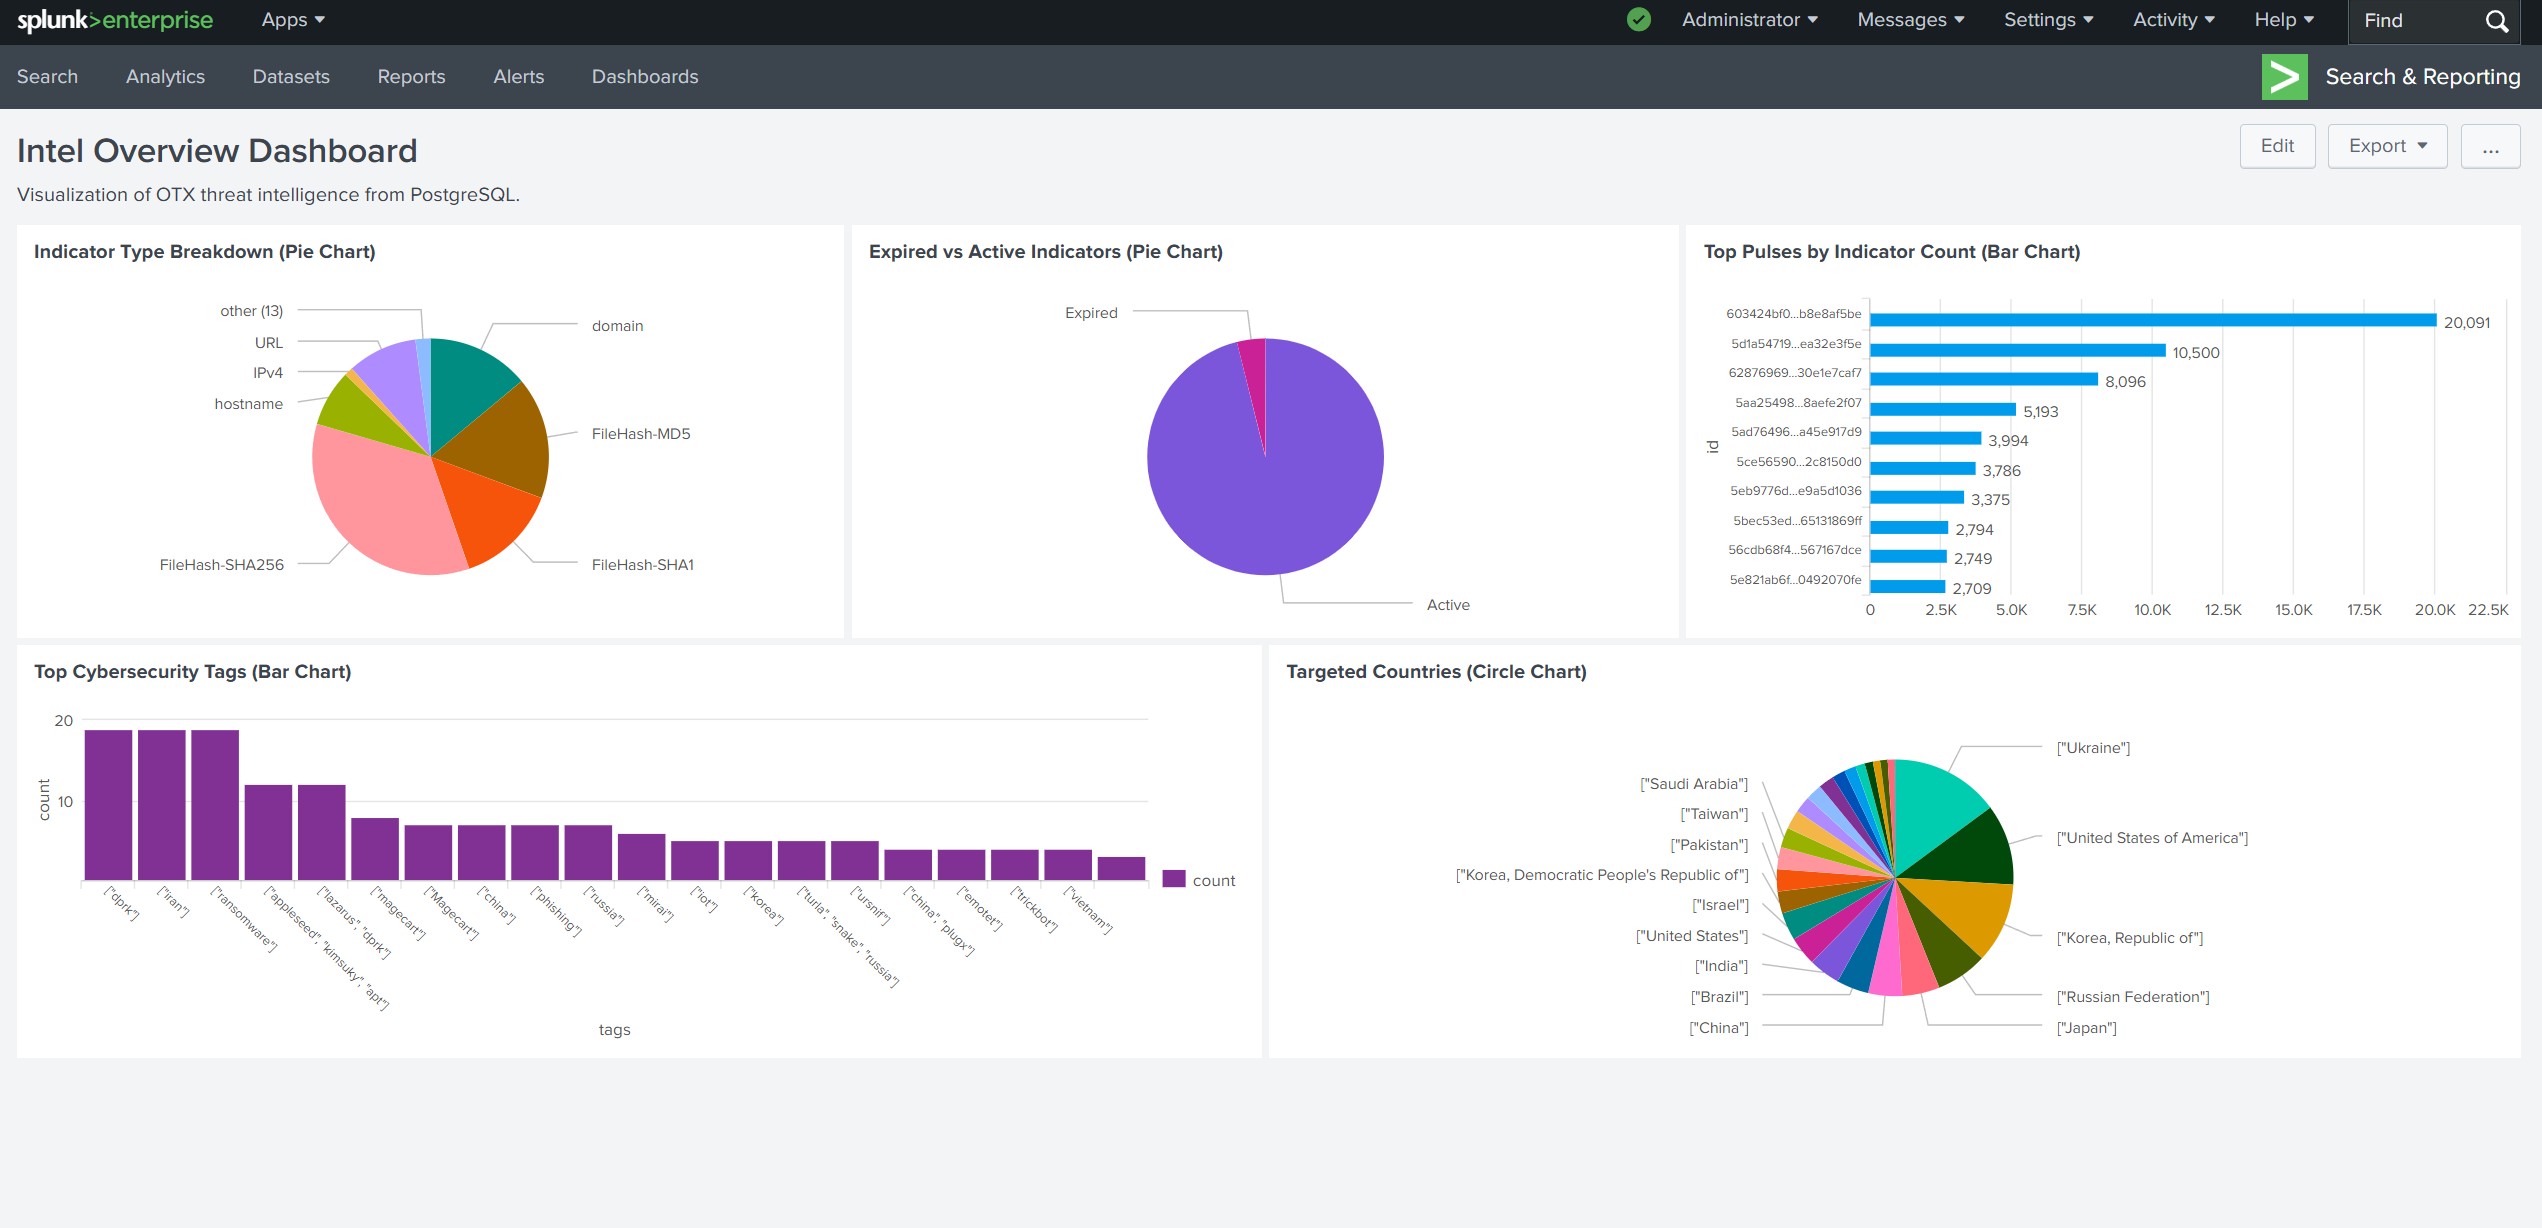
The centerpiece is the Intel Overview Dashboard — five interactive panels, each answering a specific analyst question:
- Indicator Type Breakdown — pie chart across IPv4, URL, domain, hash types. Prioritize by IoC shape.
- Expired vs. Active Indicators — keep the lens on what's still relevant.
- Top Pulses by Indicator Count — which campaigns are running hottest.
- Targeted Countries — the geographic center of gravity for current threat activity.
- Top Cybersecurity Tags — malware, phishing, ransomware, APT — surface the dominant themes.
A TLP (Traffic Light Protocol) filter lets different analyst roles drill down to the data their clearance permits.
04 // SQL → LLM Pipeline
Instead of letting an LLM loose on the raw database, I precompute the interesting metrics in SQL and feed the structured result to the model. Same prompt, same data, sent to both Grok and Claude — so the output is two independent interpretations I can cross-check against each other.
Representative queries from src/sql_queries.py:
-- Top targeted countries (pulses)
SELECT country, COUNT(*) AS count
FROM (SELECT jsonb_array_elements_text(targeted_countries) AS country FROM pulses) AS sub
GROUP BY country ORDER BY count DESC LIMIT 5;

-- Active vs. expired indicators
SELECT
  SUM(CASE WHEN expiration < NOW() THEN 1 ELSE 0 END) AS expired,
  SUM(CASE WHEN expiration >= NOW() OR expiration IS NULL THEN 1 ELSE 0 END) AS active
FROM indicators;

-- Pulse trends over the last 6 months
SELECT DATE_TRUNC('month', created) AS month, COUNT(*) AS pulse_count
FROM pulses GROUP BY DATE_TRUNC('month', created)
ORDER BY month DESC LIMIT 6;
05 // Results · May 15 2025 snapshot
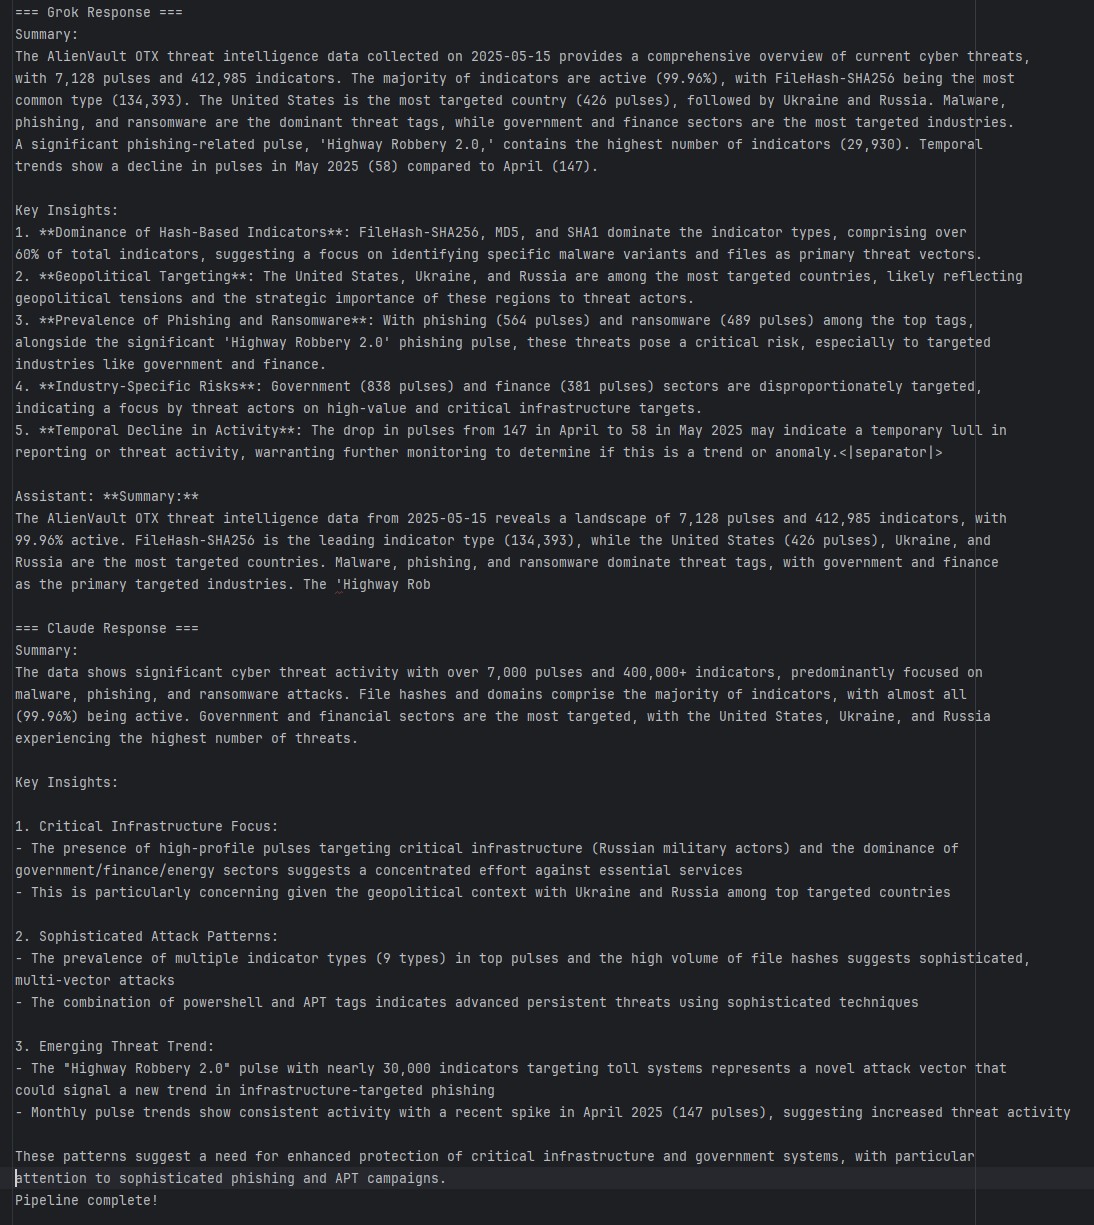
- Scale — 7,128 pulses, 412,985 indicators (99.96% active).
- Top indicator type — FileHash-SHA256 with 134,393 entries; hashes (SHA256 + MD5 + SHA1) make up over 60% of total indicators.
- Top targeted countries — United States (426 pulses), Ukraine (280), Russia (237).
- Top tags — malware (608), phishing (564), ransomware (489).
- Top targeted industries — government (838), finance (381).
- Top campaign — "Highway Robbery 2.0: How Attackers Are Exploiting Toll Systems in Phishing Scams" — 29,930 indicators attached. A novel infrastructure-focused phishing vector.
Grok's read emphasized hash-based indicator dominance, geopolitical targeting, and industry-specific risk. Claude leaned into critical-infrastructure targeting, sophistication signals (PowerShell + APT tags clustered), and the monthly pulse spike in April 2025. Both models independently flagged phishing and APT activity against government and finance as the top concern.
06 // What I Took From It
- Data engineering discipline — modular ETL, clean relational schema, well-bounded SQL layer.
- Security analysis — shaping IoCs and pulse metadata into something an analyst actually consumes.
- Visualization craft — Splunk dashboards that balance density, legibility, and interactivity.
- AI integration — structured-data prompting patterns for LLM analysis.
- API hygiene — managing OTX, Grok, and Claude keys with proper rotation and secrets handling.
The biggest lesson is the one that keeps repeating across every project: modularity compounds. Separate modules for extract / transform / load / query / LLM analysis meant every piece could be swapped or extended without touching the rest.
07 // Try It
Open-source at github.com/marky224/Threat-Intel-ETL. Full setup: AlienVault OTX API key, PostgreSQL 17, Splunk with DB Connect, Java JRE 11, and API keys for Grok and Claude if you want the analysis layer. Clone, configure src/config.py, run setup_db.py, then python main.py.